


")


")


Key Takeaways
- Visual Storytelling Mastery: Explore the transformative power of infographics, mastering the art of visual storytelling to captivate audiences and convey complex information effectively.
- Strategic Creation Process: Navigate the step-by-step guide on creating compelling infographics, from defining goals and researching data to choosing the right tools and designing for maximum impact.
- SEO Excellence: Optimize your infographics for search engines with best practices, including keyword integration, strategic metadata, and the creation of shareable embed codes, ensuring enhanced visibility and engagement.
In the ever-evolving landscape of digital content, where information is abundant and attention spans are fleeting, the power of visual communication has emerged as a beacon of engagement and comprehension.
Enter the infographic, a dynamic and visually compelling medium that transcends the boundaries of traditional textual narratives.
In this comprehensive guide, we embark on a journey to unravel the essence of infographics—what they are, why they matter, and, most importantly, how you can seamlessly create one to captivate your audience and elevate your content game.
Defining the Infographic Essence
At its core, an infographic is a harmonious blend of information and design, a graphical representation meticulously crafted to convey complex data and concepts with unparalleled clarity.
It’s not merely a visual embellishment but a strategic tool, a means to distill intricate information into a format that resonates with both the visual sensibilities of your audience and the algorithms that govern online visibility.
Why Infographics Matter in the Content Mosaic
Understanding the pivotal role infographics play in the realm of content marketing is essential.
The digital landscape is flooded with an overwhelming influx of information, and consumers are becoming increasingly discerning in their content consumption habits.
This is where infographics rise to prominence, offering a breath of fresh air amid the sea of text-heavy articles.
With their visual appeal, infographics possess the unique ability to arrest attention, enhance information retention, and make your content not only consumable but memorable.
Unlocking the Benefits
The benefits of incorporating infographics into your content strategy are manifold.
We delve into the visual allure that captivates audiences, the accessibility that transcends language and learning barriers, and the undeniable boost in social media engagement that can catapult your brand into the digital limelight.
The infographic is not merely a static image; it’s a dynamic storyteller that transforms data into a narrative, making the abstract tangible and the complex comprehensible.
Navigating the Elements of Infographic Mastery
Creating an effective infographic requires more than just an artistic flair; it demands a strategic approach.
We dissect the crucial elements that constitute an impactful infographic—clear and concise design principles, the fusion of relevant and compelling content, and the artful incorporation of visual data.
From colour schemes to fonts, from narrative flow to data accuracy, every facet is explored to equip you with the knowledge to craft infographics that leave an indelible mark.
The Journey of Creation
Embarking on the path to creating an infographic is a voyage of purpose and precision.
We guide you through the essential steps—defining your goals and audience, conducting meticulous research, selecting the right tools, and mastering the art of design.
Whether you’re a novice navigating the world of infographics or a seasoned creator seeking to refine your skills, this guide provides a roadmap for every stage of the creative process.
SEO: The Unseen Engine of Visibility
But what good is a masterpiece if it remains hidden in the vast expanse of the internet? Herein lies the importance of infusing SEO strategies into your infographic creation.
We unravel the intricacies of optimizing image file names, crafting compelling alt text, strategically placing keywords, and providing shareable embed codes.
Elevate your infographics from visually stunning to strategically visible, ensuring they reach and resonate with your target audience.
But, before we venture further, we like to share who we are and what we do.
About AppLabx
From developing a solid marketing plan to creating compelling content, optimizing for search engines, leveraging social media, and utilizing paid advertising, AppLabx offers a comprehensive suite of digital marketing services designed to drive growth and profitability for your business.
AppLabx is well known for helping companies and startups use digital marketing to drive web traffic to their websites and web apps.
At AppLabx, we understand that no two businesses are alike. That’s why we take a personalized approach to every project, working closely with our clients to understand their unique needs and goals, and developing customized strategies to help them achieve success.
If you need a digital consultation, then send in an inquiry here.
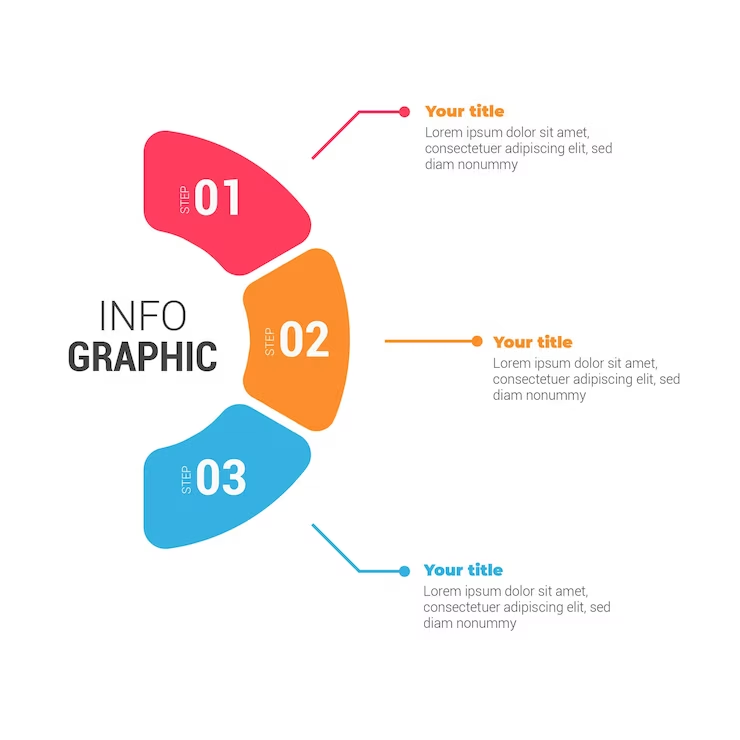
What is an Infographic? And How to Create One?
- Benefits of Using Infographics
- Elements of an Effective Infographic
- Steps to Create an Infographic
- Best Practices for Infographic SEO
1. Benefits of Using Infographics
In an era dominated by information overload, the strategic integration of infographics into your content arsenal can be a game-changer.
Beyond their aesthetic appeal, infographics offer a myriad of benefits that extend to audience engagement, information retention, and social media virality.
Let’s delve into the tangible advantages that make infographics an indispensable tool in the digital marketing landscape.
Visual Appeal and Audience Attention
- Engagement Amplified: Studies show that your content would generate 94% more views if you added visual elements. Infographics, with their vibrant colours and compelling visuals, can captivate the audience’s attention in an instant.
- Eye-Catching Graphics: The human brain processes images 60,000 times faster than text, and infographics leverage this by presenting complex data in a visually appealing manner.
This not only grabs attention but also ensures that the information is processed more efficiently. - Example: Take, for instance, an infographic breaking down a statistical analysis of market trends. The use of color-coded charts and graphs not only makes the data more digestible but also draws the viewer’s eye to key insights instantly.
Improved Accessibility and Information Retention
- Simplified Complex Data: Infographics excel in simplifying complex information. They break down intricate details into easily digestible visual snippets, ensuring that even the most intricate details are accessible to a broader audience.
- Enhanced Information Retention: By combining visuals with information, infographics enhance the retention of key messages.
- Example: Consider a health-related infographic illustrating the benefits of exercise on the human body. The combination of visuals depicting before-and-after scenarios, coupled with concise text, makes the information not only accessible but memorable.
Increased Social Media Engagement
- Shareability Factor: Infographics are highly shareable on social media platforms, contributing to increased engagement. Visual content is 40 times more likely to get shared on social media than other types of content, making infographics a potent tool for virality.
- Leveraging Visual Storytelling: Humans are naturally drawn to stories. Infographics, when designed as visual stories, tap into this innate human preference, making them more likely to be shared and engaged with on social media platforms.
- Example: A travel-related infographic showcasing the top destinations for the upcoming year. The visual appeal combined with easily shareable content makes it a perfect candidate for social media circulation.
Global Appeal and Multilingual Accessibility
- Overcoming Language Barriers: Infographics have the power to transcend language barriers. Visual representations eliminate the need for extensive text, making information universally accessible and reducing dependence on language proficiency.
- Global Reach: With the rise of online content consumption, infographics offer a global reach. They enable businesses to communicate their message effectively to diverse audiences across different regions.
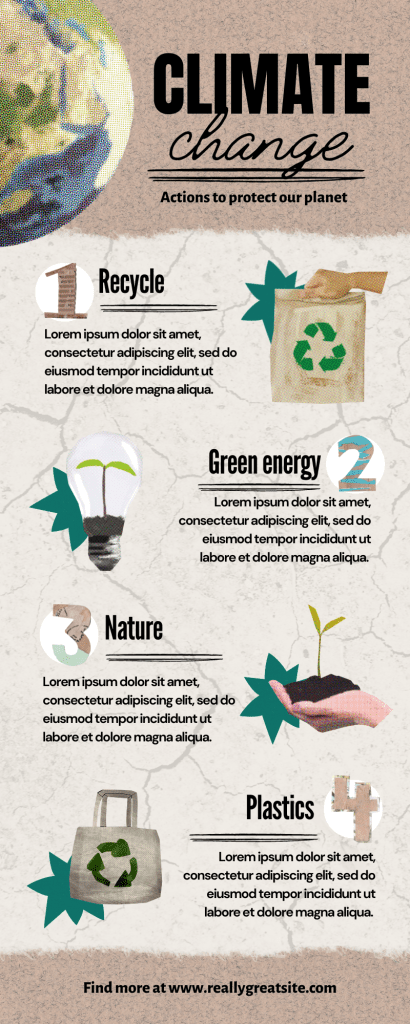
- Example: An infographic representing global climate change data with minimal text. The visual impact allows viewers from various linguistic backgrounds to comprehend the urgency of the issue without relying on language proficiency.
Enhanced Credibility through Data Visualization
- Data-backed Insights: Infographics can bolster credibility by presenting data-backed insights. Whether it’s market trends, survey results, or scientific findings, the visual representation of data lends an air of authority to the information presented.
- Building Trust: High-quality visual content can help you create a more professional and trustworthy image for your brand. Infographics, with their combination of visuals and data, contribute to building trust with your audience.
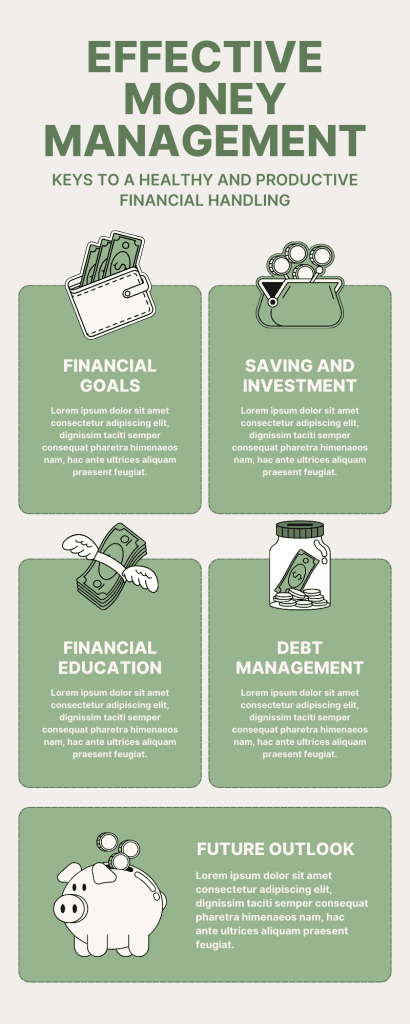
- Example: A financial infographic displaying effective money management. The incorporation of useful information, data and visual representations instils confidence in the information provided, establishing credibility with the audience.
2. Elements of an Effective Infographic
Crafting an impactful infographic involves more than just visual aesthetics—it requires a strategic fusion of design principles, compelling content, and the seamless integration of data.
In this section, we explore the key elements that contribute to the effectiveness of an infographic, backed by insights, examples, and data-driven strategies.
Clear and Concise Design
- Color Scheme and Fonts:
- A study reveals that people make a subconscious judgment about a person, environment, or product within 90 seconds of initial viewing and that between 62% and 90% of that assessment is based on colour alone.
- Example: An infographic about nutrition may use vibrant greens for vegetables, creating a visually appealing and health-conscious association.
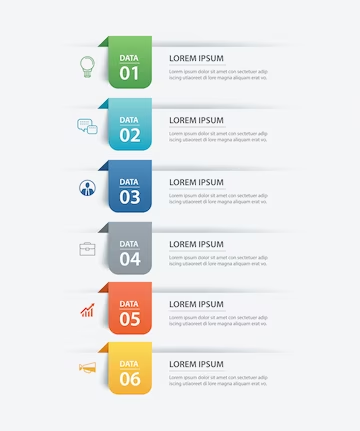
- Layout Organization:
- ‘F-Pattern’ describes the most common user ‘eye-scanning pattern’, emphasizing the importance of placing key information at the top and left side of the infographic.
- Example: A business infographic may place crucial statistics about market trends in the upper-left corner for optimal visibility.
- Whitespace Management:
- Improved Comprehension: Research suggests that “use of white space between paragraphs and in the left and right margins increased comprehension by almost 20%.
- Example: An infographic about technological advancements may strategically use whitespace to separate key concepts and avoid visual clutter.

Relevant and Compelling Content
- Identifying Key Information:
- User Attention Span: The average person’s attention span is 8 seconds. Infographics must identify and prioritize key information for quick consumption.
- Example: An educational infographic about space exploration may focus on the most groundbreaking discoveries.
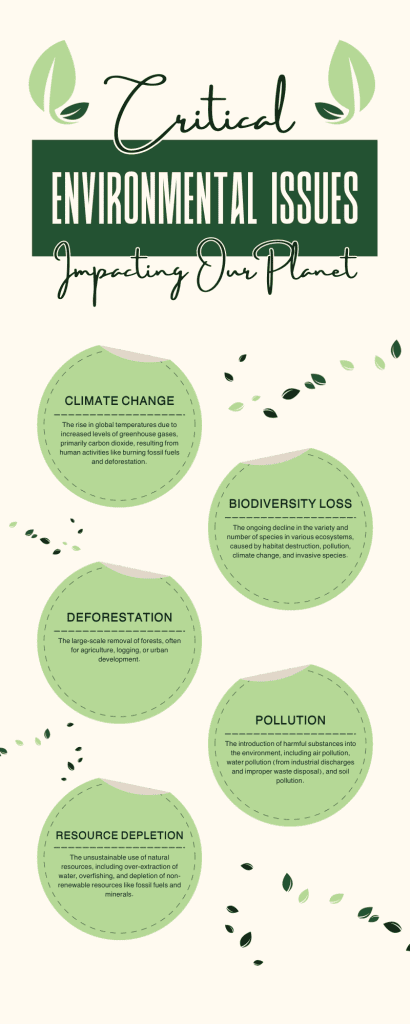
- Crafting a Compelling Narrative:
- Storytelling Impact: Our brains love visual information presented in a narrative fashion (22 times more memorable than facts alone).
- Example: An environmental infographic may narrate the critical environmental issues, emphasizing the impact on the ecosystem.
- Concise Copywriting:
- Brevity Matters: Concise copy ensures that the viewer absorbs the information without feeling overwhelmed.
- Example: An infographic about digital marketing trends may use brief, impactful statements to convey key insights.
Incorporating Visual Data
- Utilizing Charts, Graphs, and Images:
- Visual Data Impact: Research indicates that content with relevant images gets 94% more views than content without images.
- Example: A financial infographic may use pie charts and bar graphs to visually represent investment portfolio diversification.
- Ensuring Accuracy and Relevance:
- Credibility Boost: Accurate visual representation of data enhances the credibility of the information presented.
- Example: An infographic about climate change statistics may include data from reputable sources, reinforcing the accuracy of the content.
- Accessibility for Diverse Audiences:
- Visual Multilingualism: Visuals transcend language barriers and can communicate across cultures and backgrounds.
- Example: A medical infographic may use universally recognized symbols alongside text to ensure comprehension across diverse linguistic backgrounds.
3. Steps to Create an Infographic
Creating a compelling and effective infographic is a strategic process that involves careful planning, research, and design.
In this section, we outline the key steps to guide you through the infographic creation journey, supported by relevant examples and data-driven insights.

Define Your Purpose and Audience
- Identifying the Goal of the Infographic:
- Clarity Yields Results: 42% of marketers say user-generated content is a vital component of their marketing strategy.
- Example: If the goal is to showcase product features, a clear strategy might involve highlighting key functionalities through an infographic.
- Understanding the Target Audience:
- Tailoring Content: About 42% of marketers personalize their content to increase engagement and build relationships with potential buyers, emphasizing the importance of understanding and catering to your audience.
- Example: A travel-related infographic targeting adventure enthusiasts might focus on extreme sports and offbeat destinations.
Research and Collect Data
- Gathering Accurate and Reliable Information:
- Credibility Matters: Consumers want brands to be completely transparent in their branding and marketing – by making comprehensive and accurate information available to all.
- Example: An infographic about cybersecurity tips should be backed by interesting pointers and comprised of accurate reliable information.
- Citing Sources for Credibility:
- Building Trust: Clear attribution builds trust. 94% of all consumers are more likely to be loyal to a brand when it commits to full transparency.
- Example: Including citations in the footer of the infographic for statistics obtained from industry reports.

Choose the Right Tools
- Overview of Infographic Creation Tools:
- Widespread Adoption: Tools like Canva, Piktochart, and Visme are popular choices for creating infographics, catering to a wide range of skill levels.
- Example: Using Canva’s user-friendly interface to design an infographic with drag-and-drop functionality.
- Selecting a Tool Aligned with Goals:
- Ease of Use: 76% of consumers consider ease of use to be the most important feature of a website.
- Example: Opting for Piktochart if your goal is to create an infographic quickly with its user-friendly templates.
Designing Your Infographic
- Tips for Creating Visually Appealing Designs:
- Color Psychology: Color choices impact perceptions. For example, blue is often associated with trust and reliability.
- Example: Using blue hues in a financial infographic to evoke a sense of trust in the presented data.
- Balancing Creativity with Clarity:
- Visual Clarity: 38% of people will stop engaging with a website if the content/layout is unattractive.
- Example: Balancing creativity with clear visuals, avoiding clutter to maintain an engaging but comprehensible design.
Adding Text and Visual Elements
- Writing Concise and Engaging Copy:
- Optimal Length: Cramming multiple paragraphs with more than 50 words can make the blog look content-fat, but it won’t keep the audience engaged.
- Example: Craft concise yet impactful copy for an infographic about technology trends, focusing on key insights.
- Integrating Visuals to Enhance the Narrative:
- Storytelling with Images: The human brain processes images 60,000 times faster than text, making it a powerful tool for conveying a narrative.
- Example: Using a sequence of images to narrate the lifecycle of a product in a manufacturing infographic.
Review and Refine Your Infographic
- Iterative Refinement:
- Feedback Incorporation: A well-maintained, updated website reflects positively on your brand image and can help build trust with customers.
- Example: Seeking feedback on an infographic prototype and making necessary revisions before the final release.
- Ensuring Accuracy and Consistency:
- Avoiding Misinformation: Inaccurate information damages credibility.
- Example: Double-checking statistics and ensuring consistency in design elements.
4. Best Practices for Infographic SEO
Optimizing your infographics for search engines is paramount to ensure their visibility and reach a wider audience.
In this section, we’ll explore the best practices for Infographic SEO, supported by relevant examples and data-driven strategies.
Optimizing Image File Names and Alt Text
- Importance of Descriptive File Names:
- Search Engine Preference: Search engines rely on descriptive file names to understand the content. Ensure your infographic file name is relevant to the content.
- Example: Instead of “image123.jpg,” use a file name like “digital-marketing-trends-infographic.jpg” for an infographic on marketing trends.
- Writing Relevant Alt Text for Accessibility and SEO:
- Accessibility Boost: Alt text provides context for visually impaired users and is crucial for SEO.
- Example: Alt text for the aforementioned infographic could be “Visualizing key digital marketing trends for 2023.”
- According to Google, wherever possible, make sure images are placed near relevant text and on pages that are relevant to the image subject matter.
Strategic Placement of Keywords
- Identifying and Incorporating Relevant Keywords:
- Keyword Research: Conduct thorough keyword research to identify terms related to your infographic content.
- Example: For an infographic about sustainable living, keywords like “eco-friendly lifestyle” and “green living tips” could be strategically incorporated.
- Ensuring Natural Keyword Integration within the Infographic:
- Avoid Keyword Stuffing: Integrate keywords naturally within the infographic content to maintain readability.
- Example: Instead of overloading the text with keywords, seamlessly incorporate them in headers and captions.
Providing Shareable Embed Codes
- Making it Easy for Others to Share and Embed the Infographic:
- Embed Code Generation: Create an embed code that allows others to easily share your infographic on their websites.
- Example: Offer an HTML embed code for your infographic so that bloggers and publishers can easily include it in their articles.
- Leveraging Embeds for Backlink Opportunities:
- Backlink Quality: Infographic embeds on other websites can generate valuable backlinks, contributing to your site’s authority.
- Example: An industry-specific blog may embed your infographic on a relevant topic, providing a quality backlink to your site.
- Google’s ranking algorithm uses backlinks to determine the authority of a website.
Responsive Design for Mobile Accessibility
- Mobile-Friendly Infographic Design:
- Responsive Layout: Design your infographic to be responsive, ensuring optimal viewing and interaction on various devices.
- Example: A travel infographic should be easily readable on both desktops and mobile devices, accommodating different screen sizes.
- Mobile Accessibility Impact on SEO:
- Mobile-First Indexing: Google prioritizes mobile-friendly content, impacting search rankings.
- Example: An infographic optimized for mobile devices ensures a positive user experience and aligns with Google’s mobile-first indexing approach.
- Google predominantly uses the mobile version of a site’s content, crawled with the smartphone agent, for indexing and ranking.
Optimizing Infographic Metadata
- Metadata Importance for Search Engines:
- Title and Description: Craft a compelling title and description for your infographic, incorporating relevant keywords.
- Example: An infographic about productivity hacks could have a title like “Boost Your Efficiency: Productivity Hacks Explained.”
- Schema Markup for Enhanced Visibility:
- Structured Data Implementation: Utilize schema markup to provide search engines with additional context about your infographic.
- Example: Adding schema markup for “ImageObject” can enhance the search engine’s understanding of the infographic content.
Conclusion
In the dynamic realm of digital content, where information inundates users from all angles, the art of effective communication is paramount.
As we conclude this extensive exploration into the world of infographics, we’ve embarked on a journey unravelling the essence of these visual narratives, understanding their significance, and delving into the intricacies of crafting your own.
The Power of Visual Storytelling
Infographics stand as more than just aesthetically pleasing images; they are powerful tools of visual storytelling.
As we’ve discovered, they possess the ability to captivate attention, simplify complex data, and foster engagement in a world where attention spans are scarce.
The fusion of information and design creates a narrative that transcends traditional text-based communication, making it an indispensable asset for content creators, marketers, and businesses alike.
Unveiling the Benefits
The benefits of incorporating infographics into your content strategy are multifaceted.
From the visual appeal that entices viewers to the enhanced accessibility that breaks down language barriers, infographics offer a versatile solution to the challenges posed by the information age.
As social media engagement becomes a cornerstone of online visibility, the shareability and virality of infographics elevate them to an unrivalled status in the realm of digital communication.
Navigating the Elements of Mastery
Creating an effective infographic requires a strategic approach, and we’ve navigated through the essential elements that constitute an impactful visual narrative.
From the clarity of design to the relevance of content and the artful incorporation of visual data, each element plays a pivotal role in ensuring your infographic not only grabs attention but also conveys its intended message with precision and impact.
A Roadmap to Creation
Armed with insights into the purpose of your infographic and a deep understanding of your target audience, we’ve ventured into the practical steps of crafting these visual masterpieces.
From gathering accurate data to selecting the right tools and designing with a balance of creativity and clarity, each step contributes to the seamless creation of an infographic that resonates with your audience.
Optimizing for Visibility
As we delve into the realm of SEO for infographics, the significance of optimizing image file names, incorporating strategic keywords, providing shareable embed codes, ensuring mobile accessibility, and optimizing metadata becomes clear.
These best practices not only enhance the search engine visibility of your infographics but also contribute to a holistic approach to reaching and engaging your target audience.
A Call to Action
As we stand at the intersection of creativity and strategy, this exploration serves as a call to action for creators, marketers, and communicators to harness the power of infographics.
Whether you’re looking to convey complex data, tell a compelling story, or boost your online presence, infographics offer a versatile and impactful solution.
Embrace the Visual Revolution
As we conclude this exploration, the call to embrace the visual revolution is clear.
The ability to convey information seamlessly, engage audiences effortlessly, and optimize for visibility ensures that your message not only reaches but resonates in the vast digital landscape.
Whether you’re a seasoned professional or a newcomer to the world of infographics, the journey of visual storytelling awaits, inviting you to shape narratives, captivate audiences, and leave an indelible mark on the digital canvas.
If you are looking for a top-class digital marketer, then book a free consultation slot here.
If you find this article useful, why not share it with your friends and business partners, and also leave a nice comment below?
We, at the AppLabx Research Team, strive to bring the latest and most meaningful data, guides, and statistics to your doorstep.
To get access to top-quality guides, click over to the AppLabx Blog.
People also ask
What are infographics and examples?
Infographics are visual representations of information, combining data, text, and visuals to convey complex concepts in a concise and engaging format. For example, a nutrition infographic may use charts and images to illustrate daily nutrient intake, making information easily digestible and visually appealing.
How to create an infographic?
To create an infographic, define your goal and audience, research relevant data, choose design tools like Canva or Piktochart, design with a balance of creativity and clarity, optimize for SEO by adding descriptive file names, keywords, and shareable embed codes, and ensure mobile-friendly design.
How to write a good infographic?
Write a good infographic by crafting concise and engaging copy, identifying key information, using a narrative structure, integrating visuals that enhance the story, and ensuring accuracy. Maintain a balance between creativity and clarity to create an impactful and memorable visual narrative.


 Image Sizes in 2024: The Ultimate Guide")


