


")


")


Key Takeaways
- Leverage Insights: Heat maps illuminate user behaviour, guiding marketers to optimize elements for enhanced engagement.
- Avoid Pitfalls: Navigate the digital landscape wisely by sidestepping common mistakes in heat map interpretation and implementation.
- Strategic Implementation: From selecting tools to integrating data, master the art of effective heat map utilization for informed decision-making in marketing.
Welcome to our comprehensive guide on “What Are Heat Maps and How to Use Them for Marketing?”
In the dynamic landscape of digital marketing, staying ahead requires a nuanced understanding of user behaviour, and that’s where heat maps emerge as invaluable tools.
In this detailed exploration, we’ll unravel the mysteries behind heat maps, shedding light on their definition, types, and most importantly, how they can be wielded as potent instruments in your marketing arsenal.
The Crucial Role of Heat Maps in Marketing
In a world inundated with information and choices, a user’s journey on your website is akin to navigating a bustling city.
As marketers, deciphering the intricacies of this journey is paramount for optimizing user experience, conversions, and overall online success.
This is precisely where heat maps step in, offering a visual representation of user interactions on your website.
Defining Heat Maps
Heat maps are graphic representations that use colour variations to illustrate the intensity of user activity on specific areas of a webpage.
By transforming complex data into a visually intuitive format, heat maps empower marketers to discern patterns, identify hotspots, and make informed decisions to enhance their online presence.
Why Heat Maps Matter
Understanding user behaviour is the cornerstone of effective marketing strategies. Heat maps provide a unique vantage point, allowing marketers to go beyond traditional analytics and witness how users engage with their content.
From analyzing click-through rates to tracking scroll depth, these maps offer a holistic view of user interactions, guiding marketers toward optimizing their websites for maximum impact.
Unpacking the Types of Heat Maps
Not all user interactions are created equal, and heat maps come in various types, each offering a specialized lens into different aspects of user engagement.
In the subsequent sections of this guide, we will delve into the practical aspects of creating and interpreting heat maps.
We will demystify the process, exploring the tools at your disposal and offering a step-by-step guide to harnessing the power of heat maps for marketing success.
Whether you’re a seasoned marketer or just starting your digital journey, join us on this exploration of heat maps—an indispensable tool that empowers you to not only understand but also influence the user’s journey through the digital realm.
Let’s embark on a journey of discovery and mastery as we unravel the secrets of heat maps and learn how to leverage them for unparalleled marketing prowess.
But, before we venture further, we like to share who we are and what we do.
About AppLabx
From developing a solid marketing plan to creating compelling content, optimizing for search engines, leveraging social media, and utilizing paid advertising, AppLabx offers a comprehensive suite of digital marketing services designed to drive growth and profitability for your business.
AppLabx is well known for helping companies and startups use digital marketing to drive web traffic to their websites and web apps.
At AppLabx, we understand that no two businesses are alike. That’s why we take a personalized approach to every project, working closely with our clients to understand their unique needs and goals, and developing customized strategies to help them achieve success.
If you need a digital consultation, then send in an inquiry here.
What Are Heat Maps and How to Use Them for Marketing?
- Types of Heat Maps
- How to Create Heat Maps
- Benefits of Using Heat Maps in Marketing
- Common Mistakes to Avoid
- Tips for Effective Implementation
1. Types of Heat Maps
In the realm of digital marketing, understanding user behaviour is paramount, and heat maps serve as powerful navigational tools.
Let’s delve into the various types of heat maps, each providing a unique perspective on user interactions.
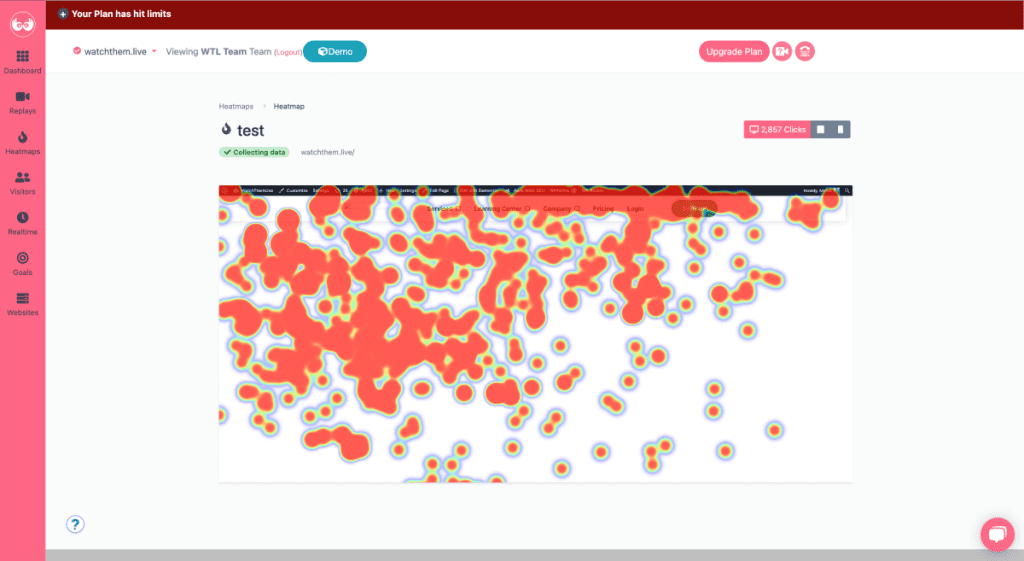
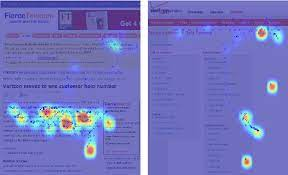
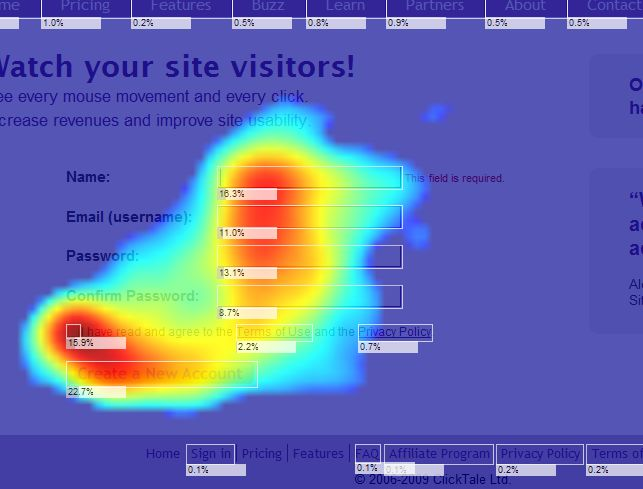
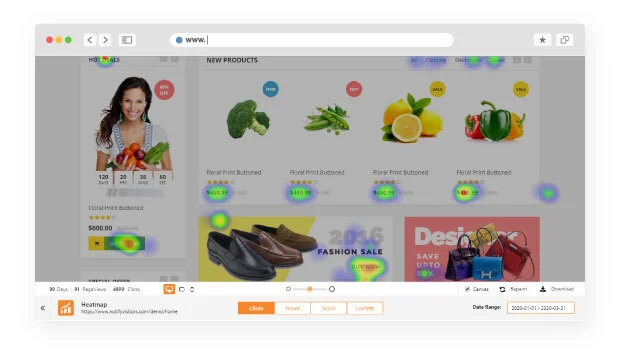
Click Maps: Deciphering User Engagement
Click maps offer a visual representation of user clicks on a webpage, highlighting hotspots of interaction.
These maps are instrumental in identifying the most engaging elements and optimizing the placement of crucial components on your site.
Example: Consider a scenario where a prominent CTA button is strategically placed in the header of an e-commerce website.
A click map might reveal that users frequently click on a secondary button in the footer, indicating a potential missed opportunity in the current design.
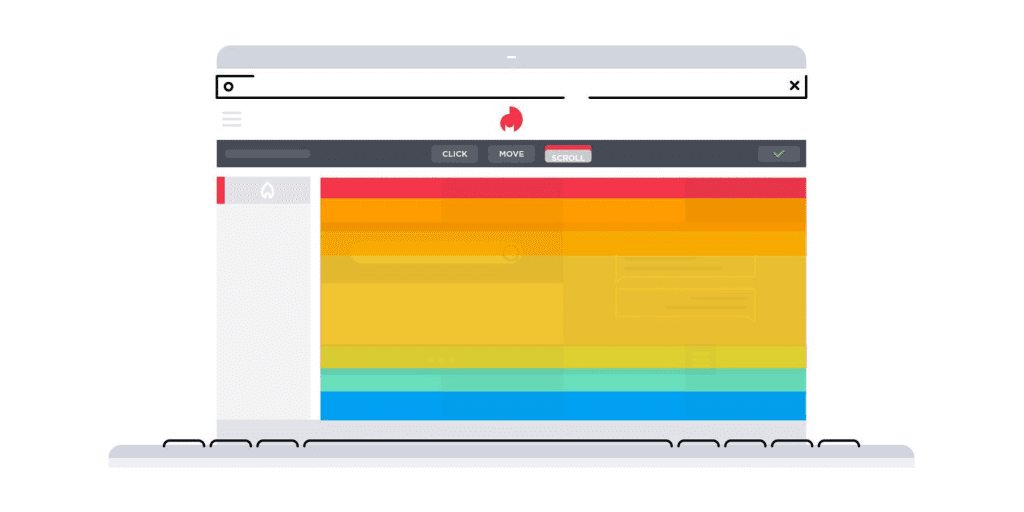
Scroll Maps: Visualizing Content Engagement
Scroll maps provide insights into user engagement by illustrating how far visitors scroll down a webpage.
This type of heat map is invaluable for optimizing content placement and ensuring that crucial information is presented within the most viewed sections of a page.
- Example: An analytics platform might use a scroll map to identify a drop-off point in a long-form blog post. This information can guide content creators to refine and condense information in critical sections, keeping users engaged throughout.
- According to a study, 55% of visitors only spend 15 seconds actively on a website, emphasizing the need to capture and retain user attention within a short scroll.
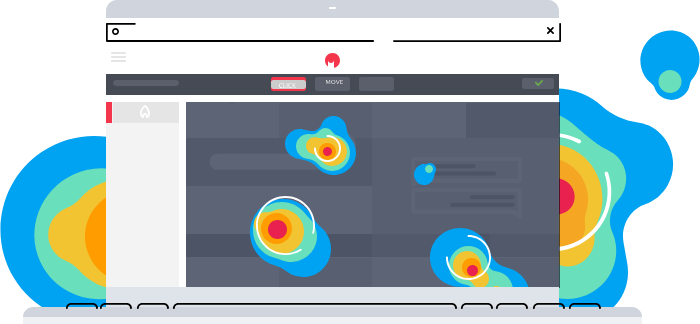
Move Maps: Tracing Cursor Pathways
Move maps go beyond clicks, tracking the movement of the mouse cursor across a webpage.
These maps unveil not only where users click but also the path they follow, offering deeper insights into user behaviour and interaction patterns.
Example: A Move Map might reveal that users frequently move their cursor toward an image carousel but seldom engage with it. This data can prompt marketers to reconsider the content or placement of the carousel for improved engagement.
Hover Maps: Unveiling User Interest without Clicks
Hover maps provide a nuanced view of user interest by showcasing where users hover their cursors without clicking. This subtle interaction can reveal areas of curiosity, helping marketers tailor content or Call to Action based on user preferences.
Example: On an online product page, a hover map might reveal that users frequently hover over product images without clicking. This insight prompts the addition of more interactive elements or CTAs directly linked to the product images.
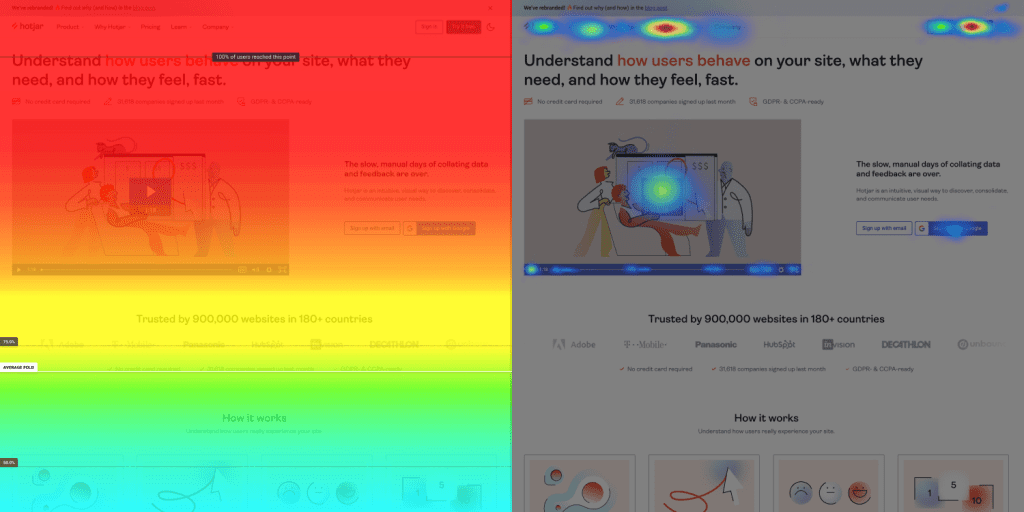
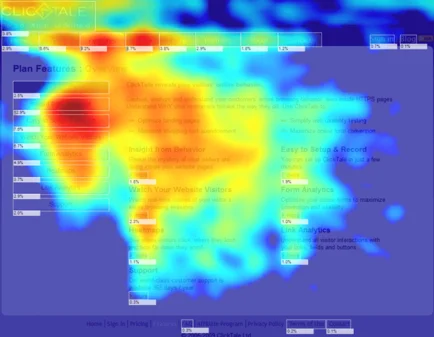
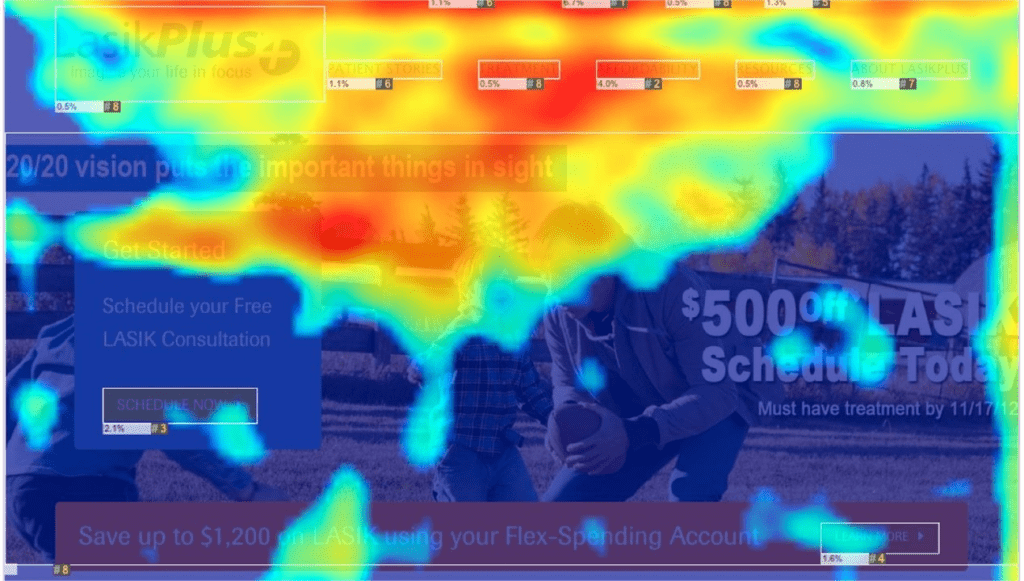
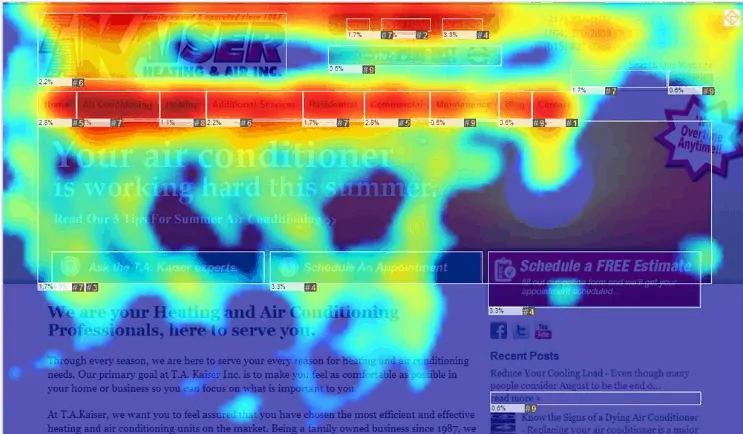
Attention Maps: Focusing on Visual Hotspots
Attention maps take into account the time users spend viewing specific elements on a page, providing a heatmap based on the duration of visual focus.
This type of heat map is crucial for optimizing the visibility of key content and ensuring it captures user attention effectively.
- Example: An attention map might reveal that users spend significantly more time on a video embedded in a blog post compared to other elements. This information prompts marketers to create more video content for increased engagement.
- Initial eye movement focuses on the upper left corner of the page.
2. How to Create Heat Maps
Creating effective heat maps involves a strategic combination of tools, techniques, and data interpretation.
Let’s embark on a comprehensive guide that outlines the process of generating insightful heat maps for your marketing endeavours.
Selecting the Right Tools for Heat Map Generation
Choosing the appropriate tool is the foundation of successful heat map creation.
Various platforms offer diverse features catering to different needs. Here are key considerations:
- Popular Tools: Platforms like Hotjar and Google Analytics provide robust heat mapping capabilities.
- Comparative Analysis: Conduct a thorough comparison to select a tool that aligns with your specific requirements and budget constraints.
Setting Up Tracking for Accurate Data Capture
Once you’ve chosen your preferred tool, it’s crucial to set up tracking parameters to ensure accurate data capture. Consider the following steps:
- Define Goals: Clearly outline the objectives of your heat map analysis, whether it’s understanding user clicks, scroll depth, or cursor movements.
- Install Tracking Code: Integrate the tracking code provided by your chosen tool into your website’s HTML. This code is essential for collecting user interaction data.
Customizing Heat Map Parameters for Precision
Tailoring heat map parameters enhances the precision of your analysis.
Customization allows you to focus on specific elements and interactions. Follow these customization tips:
- Specify Pages: Select the specific pages or sections of your website you want to analyze. This can be particularly useful for targeted insights.
- Adjust Sensitivity: Most tools allow you to adjust the sensitivity of your heat maps. Experiment with sensitivity levels to capture nuanced user interactions.
Interpreting Heat Map Data: A Practical Guide
Creating heat maps is only half the battle; interpreting the data is where the real insights unfold.
Consider these strategies for effective interpretation:
- Colour Legend Analysis: Understand the colour legend of your heat map. Typically, warmer colours indicate higher user interaction, while cooler colours signify less engagement.
- Focus on Hotspots: Identify hotspots or areas with the highest concentration of interaction. These zones often represent critical touchpoints for users.
- Cross-Referencing with Analytics: Integrate heat map data with your existing analytics tools. This cross-referencing helps in deriving holistic insights into user behaviour.
Examples of Heat Map Utilization
Let’s explore practical scenarios where businesses have effectively used heat maps to optimize their online presence:
- E-commerce Product Placement: An online retailer, using a click map, identified that users were frequently clicking on product images but not on the accompanying product descriptions.
This insight led to a redesign, placing more emphasis on visual elements and enhancing product visibility. - Content Engagement on a Blog: A content marketing platform, leveraging scroll maps, discovered that users were abandoning lengthy blog posts midway. This prompted a content strategy shift toward concise, informative articles, resulting in increased reader engagement.
Comparative Analysis of Heat Mapping Tools
Understanding the strengths and limitations of different heat mapping tools is essential.
Consider these factors for a well-informed decision:
- User-Friendliness: Evaluate the user interface and ease of use to ensure seamless navigation through the tool.
- Data Security: Prioritize tools that adhere to stringent data security measures, safeguarding sensitive user information.
- Integration Capabilities: Opt for tools that seamlessly integrate with your existing analytics and marketing stack for a cohesive workflow.
Iterating and Testing for Continuous Improvement
The digital landscape is dynamic, necessitating continuous improvement based on evolving user behaviours.
Adopt these practices for ongoing optimization:
- Regular Monitoring: Schedule regular intervals to review and update your heat maps. Changes in user behaviour may necessitate adjustments to your strategy.
- A/B Testing: Conduct A/B testing to validate the effectiveness of changes made based on heat map insights. This iterative process ensures ongoing refinement of your digital assets.
3. Benefits of Using Heat Maps in Marketing
In the fast-paced world of digital marketing, staying ahead requires not just data but meaningful insights.
Heat maps emerge as indispensable tools, providing a visual representation of user interactions on your website.
Let’s delve into the multifaceted benefits of incorporating heat maps into your marketing strategy.

User Behavior Analysis: Understanding Click Patterns
Heat maps offer a granular view of user interactions, particularly in terms of clicks, providing marketers with invaluable insights into user behaviour.
Example: An e-commerce site, utilizing a click map, discovered that users were repeatedly clicking on a non-clickable element, assuming it was a link. This insight prompted a redesign, preventing user frustration and enhancing overall user experience.
Conversion Rate Optimization: Enhancing Call-to-Action Placement
Optimizing conversion rates is a perpetual goal for marketers, and heat maps serve as invaluable allies in achieving this objective by shedding light on the effectiveness of CTA elements.
Example: A subscription-based service, leveraging a click map, identified that users were overlooking the primary CTA button. A strategic relocation of the button resulted in a substantial increase in conversion rates.
Website Redesign Insights: Recognizing Areas for Improvement
Revamping your website for optimal user experience requires precision, and heat maps act as a compass, guiding marketers toward areas that demand attention.
- Example: A software company, utilizing a scroll map, identified that users were abandoning their product features page before scrolling to the bottom. This revelation prompted a redesign, condensing vital information into the upper sections, resulting in increased engagement.
- According to a survey, 48% of users say that website design is the most important factor in determining a business’s credibility.
Content Engagement Analysis: Tailoring Content for User Preferences
Understanding how users engage with your content is pivotal for crafting a content strategy that resonates.
Heat maps, especially scroll maps, provide insights into user engagement with your articles, blog posts, or product descriptions.
Example: A news website, utilizing a scroll map, found that users were losing interest in lengthy articles halfway through. Adjusting content length and incorporating visual elements led to a significant increase in average reading time.

Mobile User Experience Optimization: Catering to On-the-Go Audiences
With the surge in mobile device usage, ensuring an optimized experience for mobile users is non-negotiable.
Heat maps help identify specific mobile user behaviours that can inform mobile design strategies.
- Example: An online retailer, utilizing a mobile heat map, discovered that users were struggling with a specific navigation element on their mobile site. A redesign of the navigation structure resulted in a substantial decrease in bounce rates.
- In the first quarter of 2023, mobile devices (excluding tablets) generated 58.33 per cent of global website traffic, highlighting the significance of mobile optimization.
Data-Driven Decision Making: Enhancing Marketing Strategies
One of the most powerful benefits of heat maps is their role in facilitating data-driven decision-making.
Marketing strategies can be refined, and campaigns optimized based on real-time user interaction data.
- Example: A digital marketing agency, using a combination of heat maps and A/B testing, refined its email marketing strategy by identifying the most clicked sections.
- Leaders in data-driven marketing are more than six times more likely than laggards to report achieving a competitive advantage in increasing profitability.
4. Common Mistakes to Avoid
As powerful as heat maps are for illuminating user behaviour, their effectiveness hinges on proper implementation and interpretation.
Let’s explore the common pitfalls that marketers often encounter and how to steer clear of these errors.

Misinterpreting Heat Map Data: A Costly Oversight
One of the most prevalent mistakes is misinterpreting the data generated by heat maps, leading to misguided decisions.
- Example: A retail website observed a high concentration of clicks on an image carousel and assumed it was a popular feature.
However, further analysis revealed that users were clicking multiple times to scroll through images, indicating confusion. This misinterpretation could have resulted in unnecessary design changes. - Guidance: Invest time in thoroughly understanding the colour legend of your heat map, ensuring accurate interpretation. Seek professional guidance if needed.
Overlooking Mobile User Behavior: Neglecting a Dominant Audience
With the proliferation of mobile devices, neglecting mobile user behaviour can be a critical error, given the distinct challenges and preferences of on-the-go audiences.
- Example: An e-commerce platform focused solely on desktop heat maps and failed to recognize that a significant portion of its users accessed the site via mobile devices. This oversight led to suboptimal mobile user experiences and, subsequently, lower conversion rates.
- Guidance: Ensure your heat map analytics include mobile-specific insights. Platforms like Hotjar offer mobile heat map functionalities for comprehensive analysis.
Failing to Test and Iterate: Stagnancy Breeds Inefficiency
A common pitfall is implementing heat maps without an iterative approach. Failing to test and refine strategies can lead to missed opportunities for optimization.
- Example: An online news portal incorporated heat maps to analyze user engagement but failed to regularly test and iterate. Consequently, the website design became outdated, and user engagement declined over time.
- Guidance: Schedule regular intervals for reviewing and updating heat maps. A/B testing allows for continuous improvement based on evolving user behaviours.
Ignoring Cross-Device Consistency: Seamless User Journeys Matter
Inconsistencies in user experience across devices can hinder overall user satisfaction and negatively impact conversion rates.
- Example: A travel booking website had a seamless desktop experience, but mobile users faced challenges in navigation and encountered different page layouts. This inconsistency resulted in a significant drop-off rate among mobile users.
- Guidance: Ensure a consistent user experience across devices by analyzing heat maps for both desktop and mobile platforms. Address any disparities to create a seamless journey.
Disregarding User Feedback: The Human Element Matters
Relying solely on heat maps without considering qualitative user feedback can be a missed opportunity to truly understand user sentiments and preferences.
- Example: A software company solely relied on heat maps to analyze user interactions with their application. They missed crucial insights into user frustrations and desires that only surfaced through direct user feedback.
- Guidance: Integrate qualitative user feedback mechanisms alongside heat map analysis to gain a comprehensive understanding of user experiences.
Overlooking the Impact of Page Load Speed: A Crucial Factor
Page load speed significantly influences user engagement, and neglecting its impact on heat map analysis can lead to skewed insights.
- Example: An online retailer noticed high abandonment rates on a product page through heat maps but failed to consider the slow loading times. Improving load speed, rather than design changes, was the key to reducing bounce rates.
- Guidance: Use tools like Google PageSpeed Insights to assess and enhance page load speed. Consider load times when interpreting heat map data to distinguish between design-related issues and performance issues.

Focusing Solely on Single Page Metrics: The Big Picture Matters
Isolating analysis to individual pages may cause marketers to overlook holistic trends that span multiple pages and user journeys.
- Example: An educational platform analyzed heat maps for specific course pages and missed the overarching trend that users frequently navigated from course pages to the blog section. This oversight hindered the optimization of cross-linking strategies.
- Guidance: Analyze heat maps for user journeys that span multiple pages. Understand how users navigate through your site to optimize overall user experience.
5. Tips for Effective Implementation
As you embark on the journey of harnessing heat maps for insightful data analytics, strategic implementation is key.
Here, we outline essential tips to ensure that your utilization of heat maps is both effective and impactful.
Selecting the Right Heat Mapping Tool: The Foundation of Success
Choosing the right heat mapping tool lays the groundwork for successful implementation.
Several reputable platforms offer diverse features to cater to your specific needs.
The global business intelligence and analytics market is expected to reach a value of USD 60.49 Billion by 2027, reflecting the increasing importance of analytics tools.
Defining Clear Objectives: Aligning Heat Maps with Goals
Clearly defining your objectives is fundamental to effective implementation. Determine what aspects of user behaviour you aim to analyze and optimize.
- Example: A content-driven website aimed to enhance user engagement. By setting clear objectives, they focused on analyzing scroll maps to understand how users navigated through lengthy articles, leading to content optimization.
- Guidance: Establish specific goals, such as improving click-through rates, reducing bounce rates, or enhancing conversion rates, to guide your heat map analysis.
Integrating Heat Maps with Other Analytics Tools: Holistic Insights Matter
Maximize the value of your data by integrating heat map insights with other analytics tools. This holistic approach provides a comprehensive understanding of user behavior.
Example: An online retailer combined heat map analysis with Google Analytics data. By cross-referencing information, they identified that users from a specific geographic region had distinct interaction patterns, allowing for targeted marketing campaigns.
Segmenting Data for Targeted Insights: Precision in Analysis
Segmenting heat map data allows for more targeted insights into specific user groups, helping to tailor strategies based on distinct demographics or user behaviors.
- Example: A subscription-based platform segmented its heat map data based on user subscription levels. This segmentation revealed varying engagement patterns, enabling personalized communication strategies.
- Guidance: Utilize segmentation based on parameters like demographics, user journey stages, or subscription levels to uncover nuanced insights.
Regularly Monitor and Update Heat Maps: Adapting to User Trends
The digital landscape is dynamic, and user behavior evolves over time. Regularly monitoring and updating your heat maps ensures that your insights remain relevant.
Example: An online news portal observed a shift in user preferences toward video content. By regularly updating their heat maps, they identified the surge in video engagement and adjusted their content strategy accordingly.
Combine Heat Maps with User Feedback: Balancing Quantitative and Qualitative Insights
While heat maps offer quantitative insights, integrating them with qualitative user feedback provides a more holistic understanding of user experiences and preferences.
- Example: A software development company, using heat maps to analyze user interactions with their application, supplemented their findings with direct user feedback. This combination led to comprehensive usability improvements.
- Guidance: Leverage tools like surveys, reviews, or direct user feedback alongside heat maps to gain qualitative insights that complement quantitative data.
A/B Testing with Heat Maps: Iterative Optimization in Action
Combining heat maps with A/B testing allows for iterative optimization based on real-time user interactions, ensuring continual improvement.
Example: An e-commerce platform tested two variations of a product page based on insights from a heat map. By analyzing user behaviour on both versions, they identified the more effective design, resulting in increased conversion rates.
Prioritize Data Security: Safeguarding User Information
Ensuring the security of user data collected through heat maps is paramount.
Prioritize tools and platforms that adhere to stringent data security measures.
- Example: A healthcare website, dealing with sensitive patient information, opted for a heat mapping tool with robust data encryption and compliance with healthcare data protection regulations.
- Guidance: Choose tools that comply with data protection laws and prioritize the security and privacy of user information.
Conclusion
In the ever-evolving realm of digital marketing, where user behaviour shapes success, the incorporation of heat maps emerges as a navigational beacon.
This comprehensive guide has illuminated the multifaceted world of heat maps, unravelling their definition, types, and the transformative power they hold for marketers.
As we conclude this exploration into the intricacies of “What Are Heat Maps and How to Use Them for Marketing?” let’s recap the key takeaways and chart a course forward for leveraging these invaluable tools.
Unraveling the Mysteries of Heat Maps: A Recap
Heat maps, those visual canvases of user interactions, empower marketers with a unique lens into the digital journeys of their audience.
From deciphering click patterns with click maps to understanding content engagement through scroll maps, the diverse types of heat maps provide a holistic understanding of user behaviour.
Whether it’s tracking cursor pathways, unveiling user interest with hover maps, or focusing on visual hotspots with attention maps, each type serves as a strategic tool in the marketer’s arsenal.
Practical Insights into User Behavior: Stories from the Digital Trenches
From optimizing e-commerce product placements based on click maps to refining content engagement strategies through scroll maps, businesses across industries are harnessing the insights gleaned from heat maps to stay ahead of the curve.
These stories underscore the transformative potential of these tools in enhancing user experiences and driving tangible results.
A Deep Dive into Implementation: Navigating the Challenges
While the benefits of heat maps are immense, navigating the challenges of their implementation requires strategic finesse.
This guide has delved into common mistakes to avoid, ensuring that marketers steer clear of pitfalls that could compromise the accuracy and effectiveness of their analyses.
From misinterpreting data to neglecting mobile user behaviour, the insights shared provide a roadmap for optimal heat map utilization.
Tips for Effective Implementation: Maximizing Insights and Impact
Guided by a strategic compass, the implementation of heat maps becomes a nuanced art. Selecting the right tool, defining clear objectives, and integrating data sources are foundational steps.
Tips for effective implementation, ranging from segmenting data for targeted insights to combining heat maps with user feedback, provide a comprehensive playbook for marketers seeking to extract the full potential of these tools.
Embarking on Your Heat Map Journey: A Continual Exploration
In conclusion, the journey into the world of heat maps is not a one-time endeavour but a continual exploration.
Armed with the knowledge of what heat maps are, the diverse types available, and the nuances of their implementation, marketers have a powerful toolset at their disposal.
The stories of successful utilization and the cautionary tales of mistakes to avoid serve as beacons and guide marketers on a path of continual optimization and strategic refinement.
As you embark on your heat map journey, remember that each click, hover, and scroll tells a story. It’s not just about data; it’s about understanding the narrative of user interactions and crafting marketing strategies that resonate.
Heat maps are not just tools; they are allies in the pursuit of meaningful connections with your audience.
So, with heat maps as your compass, set sail into the vast sea of digital possibilities, armed with insights, strategies, and the confidence to navigate the marketing landscape with precision.
May your journey be illuminated by the vibrant colours of user engagement, and may the insights gained from heat maps propel your marketing endeavours to new heights.
If you are looking for a top-class digital marketer, then book a free consultation slot here.
If you find this article useful, why not share it with your friends and business partners, and also leave a nice comment below?
We, at the AppLabx Research Team, strive to bring the latest and most meaningful data, guides, and statistics to your doorstep.
To get access to top-quality guides, click over to the AppLabx Blog.
People also ask
How can heat maps be used?
Heat maps are versatile tools in digital marketing. They visualize user interactions, aiding in optimizing website layouts, improving click-through rates, and enhancing user experience. From analyzing click patterns to refining content strategies, heat maps guide data-driven decision-making for impactful marketing strategies.
What is the point of a heat map?
The primary purpose of a heat map is to visually represent data, making complex information easily understandable. In marketing, heat maps reveal user interactions on a website, highlighting hotspots of activity. This aids in optimizing design, content placement, and overall user experience for better engagement and conversion rates.
What is a heat map in the share market?
In the context of the stock market, a heat map visually represents the performance of various assets or indices. Color-coding is used to depict the relative strengths or weaknesses of different stocks or sectors, offering a quick overview of market trends and helping investors make informed decisions.


 Image Sizes in 2024: The Ultimate Guide")

")
