
























Key Takeaways
- Google Ads agency pricing models include flat retainers, percentage-of-ad-spend fees, hybrid structures, performance-based pricing, hourly rates, and project fees.
- Google Ads management costs depend on ad spend, campaign complexity, business model, attribution requirements, creative needs, and the level of agency expertise required.
- The best Google Ads agency pricing model balances predictable costs, transparent fees, scalable management, and measurable outcomes such as ROAS, CAC, revenue, and qualified leads.
Google Ads agency pricing typically ranges from flat monthly retainers and percentage-of-ad-spend fees to hybrid, performance-based, hourly, and project models. Google Ads determines campaign media costs, while agencies charge separately for management. Compare each pricing structure by total cost, campaign complexity, scalability, included services, and measurable business outcomes before choosing an agency.
Google Ads remains one of the most powerful paid acquisition channels for businesses seeking immediate visibility, qualified leads, online sales, and measurable revenue growth. However, while advertisers can easily control how much they spend directly on advertising, understanding what a Google Ads agency charges to manage those campaigns is considerably more complicated. Agencies use different pricing structures, include different services, and calculate their fees according to factors such as advertising spend, campaign complexity, geographic reach, account size, tracking requirements, and the level of strategic support required.
Understanding Google Ads agency pricing models is therefore essential before comparing PPC agencies or signing a management contract. Two agencies managing the same $20,000 monthly advertising budget could charge substantially different fees even when both appear to offer similar Google Ads management services. One might charge a fixed monthly retainer, another might collect 15% of advertising spend, while a third could combine a base management fee with a percentage of spend or a performance incentive.
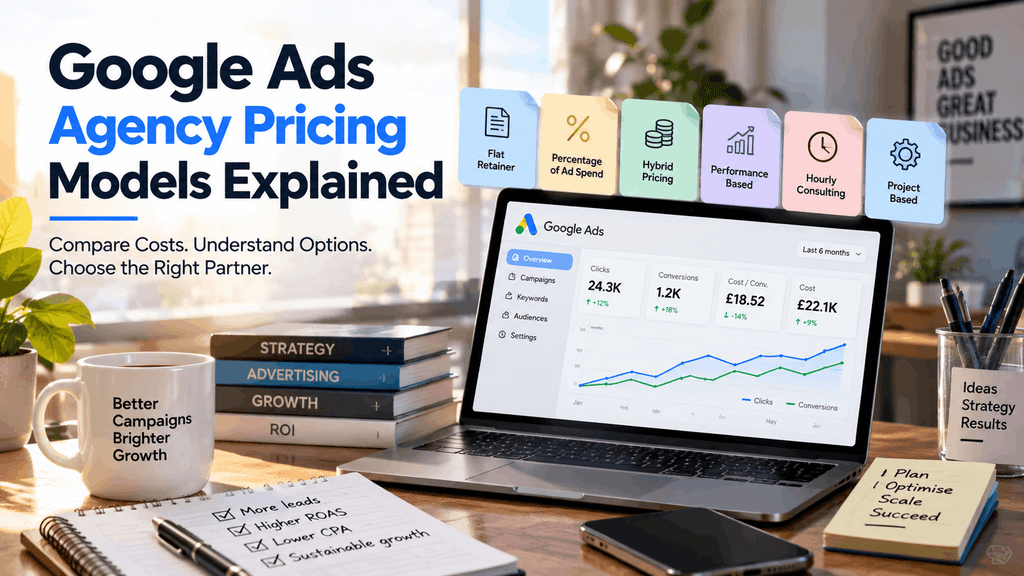
The most common Google Ads agency pricing models include flat monthly retainers, percentage-of-ad-spend pricing, hybrid pricing, performance-based compensation, hourly consulting, and fixed project fees. Each structure distributes costs and incentives differently between the advertiser and the agency.
| Google Ads Agency Pricing Model | How It Works | Typically Best Suited For |
|---|---|---|
| Flat Monthly Retainer | Fixed management fee each month | Businesses with predictable campaign scope |
| Percentage of Ad Spend | Agency fee increases with advertising spend | Advertisers with changing or growing budgets |
| Tiered Percentage | Management percentage declines at higher spend levels | Larger and scaling advertisers |
| Hybrid Pricing | Retainer combined with spend or performance fees | Growth-focused businesses |
| Performance-Based Pricing | Compensation linked to defined results | Businesses with reliable attribution |
| Hourly Pricing | Payment based on specialist time | Consulting, audits, training, troubleshooting |
| Project-Based Pricing | Fixed fee for a defined project | Account builds, migrations, audits, or tracking setup |
The differences become particularly important as advertising budgets increase. A percentage-of-spend arrangement may initially appear affordable for a small advertiser but become considerably more expensive as monthly media spend grows. Conversely, a flat retainer can look expensive relative to a small advertising budget while becoming increasingly economical at higher spending levels. Minimum management fees can further change the effective percentage a smaller advertiser actually pays.
For example, an agency charging 15% of ad spend would receive $750 per month on a $5,000 advertising budget, $3,000 on a $20,000 budget, and $15,000 on a $100,000 budget. A competing agency charging a fixed retainer could produce entirely different economics. This makes the breakeven point between pricing models an important calculation when evaluating Google Ads management costs.
Price alone, however, provides an incomplete picture. Google Ads management can involve keyword research, bidding strategy, campaign architecture, audience development, conversion tracking, attribution, Shopping feeds, Performance Max management, creative testing, landing page recommendations, reporting, experimentation, and ongoing budget allocation. A low-cost provider offering basic campaign maintenance cannot be compared directly with a specialist agency delivering sophisticated measurement and growth strategy.
Business models also influence which pricing structure makes sense. E-commerce advertisers may require product-feed optimization, Shopping campaigns, promotional management, creative testing, profitability analysis, and frequent budget adjustments. B2B companies may instead depend on CRM integration, offline conversion tracking, qualified-lead measurement, pipeline attribution, and optimization across sales cycles that can last weeks or months. Campaign complexity can therefore matter just as much as advertising spend when determining an appropriate agency fee.
Advertisers should also examine costs beyond the headline management rate. Setup charges, landing page development, creative production, call tracking, attribution platforms, reporting technology, feed-management tools, additional advertising channels, and contract termination provisions can significantly increase the total cost of an agency relationship. A seemingly inexpensive monthly retainer may become substantially more expensive once these ancillary costs are included.
The rise of automation and artificial intelligence within Google Ads makes this evaluation even more important. Automated bidding, Performance Max, audience signals, predictive optimization, and AI-assisted creative capabilities have reduced the value of agencies that simply perform routine account adjustments. Agency value is increasingly concentrated in areas such as strategic decision-making, measurement architecture, first-party data, creative direction, conversion optimization, profitability analysis, experimentation, and determining where incremental advertising budget should be deployed.
Businesses should therefore evaluate Google Ads agency pricing through the lens of total economic value rather than simply searching for the lowest monthly fee. The right question is not only, “How much does a Google Ads agency cost?” It is also whether the pricing model aligns the agency’s incentives with profitable business growth.
This guide to Google Ads agency pricing models explains how flat retainers, percentage-of-spend fees, tiered pricing, hybrid arrangements, performance-based compensation, hourly rates, and project fees work. It also examines breakeven calculations, hidden Google Ads management costs, e-commerce versus B2B requirements, agency versus in-house economics, and the factors businesses should evaluate before choosing a pricing structure. The goal is to provide a practical framework for determining not simply the cheapest Google Ads management option, but the pricing model capable of delivering the strongest combination of transparency, scalability, accountability, and long-term return on investment.
But, before we venture further, we like to share who we are and what we do.
About AppLabx
From developing a solid marketing plan to creating compelling content, optimizing for search engines, leveraging social media, and utilizing paid advertising, AppLabx offers a comprehensive suite of digital marketing services designed to drive growth and profitability for your business.
At AppLabx, we understand that no two businesses are alike. That’s why we take a personalized approach to every project, working closely with our clients to understand their unique needs and goals, and developing customized strategies to help them achieve success.
If you need a digital consultation, then send in an inquiry here.
Or, send an email to hello@applabx.com to get started.
Google Ads Agency Pricing Models Explained
- Percentage of Ad Spend
- Flat Monthly Retainer
- Hybrid Pricing Architectures
- Performance-Based and Outcome-Linked Models
- Hourly Rates and Project-Based Google Ads Engagements
- Quantitative Breakeven Modeling for Google Ads Agency Pricing
- Hidden Fees, Ancillary Costs, and Contractual Fine Print
- Vertical Dynamics: E-Commerce vs. B2B Enterprise Paid Search
- Agency Retainers vs. In-House Google Ads Management: Economic Analysis
- Strategic Decision Framework for Choosing a Google Ads Agency Pricing Model
1. Percentage of Ad Spend
Percentage-of-ad-spend pricing remains one of the most established Google Ads agency pricing models in 2026. Under this structure, the advertiser pays the agency a management fee calculated as a percentage of the monthly media budget spent through Google Ads.
Across published 2026 PPC pricing guides, approximately 10% to 20% of monthly ad spend remains a commonly quoted benchmark. Some providers charge higher effective percentages for smaller or particularly complex accounts, while larger advertisers can negotiate declining percentages or tiered fee structures as monthly media investment increases.
The basic calculation is:
Monthly Agency Management Fee = Google Ads Spend × Management Fee Percentage
| Monthly Google Ads Spend | 10% Fee | 15% Fee | 20% Fee |
|---|---|---|---|
| $5,000 | $500 | $750 | $1,000 |
| $10,000 | $1,000 | $1,500 | $2,000 |
| $25,000 | $2,500 | $3,750 | $5,000 |
| $50,000 | $5,000 | $7,500 | $10,000 |
| $100,000 | $10,000 | $15,000 | $20,000 |
These figures represent management fees only. The advertising budget paid to Google is normally a separate expense and should therefore be distinguished from the agency’s professional service fee when calculating the total Google Ads investment.
How Percentage-Based Google Ads Pricing Changes by Account Size
Although 10% to 20% provides a useful general benchmark, percentage pricing is rarely uniform across every advertising budget. Smaller accounts frequently encounter minimum monthly management fees because a percentage calculation alone may not cover the resources required for campaign strategy, tracking, optimization, reporting and client communication.
At higher spending levels, agencies may apply progressively lower percentages. Published rate cards demonstrate this declining-rate approach, with effective management percentages falling as advertising expenditure reaches larger tiers.
| Monthly Media Budget | Indicative Pricing Pattern | Indicative Management Cost | Typical Operational Requirements |
|---|---|---|---|
| $2,000 – $5,000 | 15% – 25% or minimum fee | $500 – $1,500+ | Focused Search campaigns, basic tracking, local or niche targeting |
| $5,000 – $20,000 | 15% – 20% | $750 – $4,000 | Multiple campaigns, conversion optimization, Search and Performance Max |
| $20,000 – $50,000 | 10% – 15% | $2,000 – $7,500 | Larger campaign structures, audience testing, creative iteration |
| $50,000 – $100,000 | 10% – 15% or negotiated tier | $5,000 – $15,000 | Advanced attribution, Shopping feeds, extensive testing and reporting |
| $100,000+ | Often negotiated or tiered | Custom | Enterprise reporting, multiple markets, sophisticated measurement and governance |
The ranges above should be treated as indicative planning benchmarks rather than standardized industry tariffs. Google Ads agencies independently determine their pricing, and account complexity can sometimes influence the final management fee more significantly than media spend itself.
Minimum Management Fees
Minimum monthly fees are particularly important when evaluating percentage-of-spend proposals.
For example, an agency offering Google Ads management at 15% of ad spend with a $1,000 monthly minimum would not charge $450 for managing a $3,000 advertising budget. The minimum would override the percentage calculation.
| Monthly Ad Spend | 15% Calculation | Minimum Fee | Effective Agency Fee | Effective Percentage |
|---|---|---|---|---|
| $3,000 | $450 | $1,000 | $1,000 | 33.3% |
| $5,000 | $750 | $1,000 | $1,000 | 20.0% |
| $7,500 | $1,125 | $1,000 | $1,125 | 15.0% |
| $10,000 | $1,500 | $1,000 | $1,500 | 15.0% |
| $25,000 | $3,750 | $1,000 | $3,750 | 15.0% |
Published 2026 pricing guides confirm that minimum management fees remain common alongside percentage-based arrangements.
This means advertisers should calculate the effective management percentage rather than relying solely on the percentage displayed in an agency’s proposal.
Why Agencies Use Percentage-of-Spend Pricing
The commercial logic behind this model is scalability. A larger advertising budget can correspond with additional campaigns, geographic markets, product groups, audience segments, creative testing, conversion data and reporting requirements.
| Agency Consideration | Why Higher Spend Can Increase Workload |
|---|---|
| Campaign Volume | Larger accounts may contain more campaigns and asset groups |
| Market Coverage | Scaling may introduce additional countries, regions or locations |
| Creative Testing | Higher traffic volumes can support more frequent experimentation |
| Shopping Management | Larger catalogs require greater feed and product-level oversight |
| Measurement | Larger accounts often require more sophisticated attribution |
| Budget Allocation | More campaigns create additional allocation decisions |
| Reporting | Larger organizations may require deeper stakeholder reporting |
| Risk Management | Optimization mistakes become financially more significant at scale |
Percentage pricing therefore creates an automatic mechanism for agency compensation to increase alongside account scale without renegotiating the retainer every time the advertiser increases its budget.
Advantages of Percentage-of-Spend Pricing
For advertisers, the model is relatively easy to understand and forecast. A company can estimate its management expenses directly from its planned Google Ads budget.
It can also work effectively for rapidly growing accounts where increasing media investment genuinely creates additional campaign-management requirements.
| Advantage | Strategic Value |
|---|---|
| Simple Calculation | Management costs are easy to forecast |
| Automatic Scaling | Fees expand alongside advertising investment |
| Flexible Budgeting | Suitable for advertisers with changing media budgets |
| Reduced Renegotiation | Less need to renegotiate retainers after every budget increase |
| Agency Capacity | Larger fees can support additional strategic resources |
The Incentive Alignment Problem
The principal criticism of percentage-of-spend pricing is its potential incentive conflict.
Because agency revenue increases when advertising expenditure increases, the agency can financially benefit from recommending a larger media budget. A budget increase, however, does not necessarily produce a proportional increase in profitable revenue.
For example:
| Scenario | Monthly Spend | Agency Fee at 15% | ROAS | Revenue Generated |
|---|---|---|---|---|
| Initial Campaign | $20,000 | $3,000 | 5.0x | $100,000 |
| Scaled Campaign | $30,000 | $4,500 | 4.0x | $120,000 |
| Aggressive Scaling | $40,000 | $6,000 | 3.0x | $120,000 |
In this illustrative scenario, agency compensation doubles from $3,000 to $6,000 as media spend doubles, while advertising revenue increases only from $100,000 to $120,000.
The example demonstrates why advertisers should not evaluate scaling decisions using spend or total conversions alone. Marginal ROAS, contribution margin, customer acquisition cost, lead quality and incremental profitability provide stronger measures of whether additional Google Ads investment is economically justified.
Percentage Pricing vs. Declining Tier Pricing
One method of reducing this potential misalignment is a declining percentage structure. Rather than applying the same percentage to every dollar of advertising spend, the management percentage decreases as the account reaches higher spending tiers.
| Pricing Structure | $10,000 Spend | $50,000 Spend | $100,000 Spend | Primary Characteristic |
|---|---|---|---|---|
| Fixed 15% | $1,500 | $7,500 | $15,000 | Maximum simplicity |
| Fixed 10% | $1,000 | $5,000 | $10,000 | Lower management overhead |
| Declining Percentage | Variable | Variable | Variable | Effective rate decreases with scale |
| Flat Retainer | Fixed | Fixed | Fixed until scope changes | Maximum cost predictability |
| Hybrid | Base + variable fee | Base + variable fee | Base + variable fee | Balances fixed costs with scalability |
Declining percentage schedules can become particularly relevant for enterprise advertisers because campaign-management workload does not necessarily increase proportionately with every additional dollar of media expenditure.
When Percentage-of-Spend Pricing Makes Sense
Percentage pricing can be appropriate when campaign complexity genuinely increases alongside advertising investment and when both parties have transparent performance targets.
| Business Situation | Suitability | Reason |
|---|---|---|
| Rapidly Scaling Advertiser | High | Fees can expand with campaign requirements |
| Multi-Market Campaigns | High | Increasing spend may accompany operational complexity |
| Large E-Commerce Catalog | High | Scaling can require extensive feed and campaign management |
| Stable Mature Account | Medium | Flat pricing may offer greater predictability |
| Small Advertising Budget | Low to Medium | Minimum fees can create a high effective percentage |
| Highly Automated Account | Medium | Spend growth may not correspond directly with workload |
| Enterprise Media Buyer | Medium to High | Tiered percentages may improve economics |
What Advertisers Should Check Before Signing
The headline management percentage should never be evaluated in isolation. Advertisers comparing Google Ads agency pricing should determine exactly what services the percentage includes and how the fee changes as the account grows.
| Contract Question | Why It Matters |
|---|---|
| Is there a minimum monthly fee? | Determines the true effective management percentage |
| Does the percentage decline at higher spend levels? | Can substantially reduce costs at scale |
| What counts as ad spend? | Prevents ambiguity in fee calculations |
| Are setup fees additional? | Affects first-year total cost |
| Is conversion tracking included? | Determines measurement capabilities |
| Are landing pages included? | Can materially affect total campaign costs |
| Is creative production included? | Important for Performance Max and Display campaigns |
| Are additional markets charged separately? | Relevant to international expansion |
| Who owns the Google Ads account? | Protects advertiser control and historical data |
| Which KPIs govern scaling decisions? | Helps prevent budget growth without profitability |
Ultimately, percentage-of-ad-spend pricing is neither inherently favorable nor unfavorable. Its effectiveness depends on the percentage charged, minimum fees, declining tiers, services included and, most importantly, whether the agency’s decisions are governed by profitable business outcomes rather than media expenditure alone.
2. Flat Monthly Retainer
A flat monthly retainer establishes a predetermined management fee for an agreed scope of Google Ads services. Unlike percentage-of-ad-spend pricing, the agency’s compensation does not automatically increase or decrease whenever the advertiser changes its media budget.
Current 2026 pricing references commonly place professional PPC agency retainers around $1,500 to $10,000 per month, although smaller engagements can fall below this range and sophisticated enterprise programs can exceed it. Published pricing also demonstrates considerable variation between agencies, reinforcing that retainers are primarily determined by scope and complexity rather than by a universal industry rate.
| Google Ads Management Level | Indicative Monthly Retainer | Typical Scope |
|---|---|---|
| Small or Focused Account | $500 – $1,500 | Limited campaigns, basic optimization and reporting |
| Small-to-Mid-Market | $1,500 – $3,000 | Active Search management, conversion tracking and testing |
| Mid-Market | $3,000 – $5,000 | Multiple campaigns, PMax, Shopping and deeper optimization |
| Advanced Growth Account | $5,000 – $10,000 | Multiple channels, sophisticated measurement and creative testing |
| Enterprise | $10,000+ | Multi-market strategy, advanced attribution and dedicated resources |
These figures should be viewed as planning benchmarks rather than standardized prices. The actual Google Ads management cost can vary significantly according to campaign count, advertising platforms, geographic coverage, reporting requirements, creative responsibilities and measurement complexity.
How the Flat Retainer Pricing Model Works
The advertiser and agency agree on a recurring monthly fee alongside a defined service scope. Google Ads media expenditure remains separate and is normally paid directly to Google.
For example, an advertiser could pay a $2,500 monthly agency retainer while independently operating a $20,000 Google Ads media budget.
| Cost Component | Monthly Amount | Function |
|---|---|---|
| Google Ads Media Budget | $20,000 | Paid advertising expenditure |
| Agency Retainer | $2,500 | Campaign management and strategy |
| Total Monthly Investment | $22,500 | Combined advertising and management cost |
| Effective Management Rate | 12.5% of media spend | Used for cost comparison |
If media expenditure subsequently increases to $40,000 while the $2,500 retainer remains unchanged, the effective management cost falls from 12.5% to 6.25%.
This is one of the most important economic differences between flat-fee and percentage-of-spend Google Ads pricing.
Why Advertisers Choose Flat Monthly Retainers
Predictability represents the principal advantage. Because the management fee is predetermined, businesses can forecast their Google Ads agency costs without management expenses automatically increasing whenever additional advertising budget is deployed.
| Advantage | Business Impact |
|---|---|
| Predictable Agency Cost | Simplifies monthly forecasting and budgeting |
| No Automatic Spend Markup | Increasing ad spend does not necessarily increase agency fees |
| Clear Commercial Structure | Advertiser knows the management cost in advance |
| Easier Cost Comparison | Proposals can be compared against defined deliverables |
| Efficiency Incentive | Agency can benefit from efficient account management |
| Better Spend Alignment | Less direct financial incentive to increase media expenditure purely to increase fees |
Several agencies explicitly position flat-fee management around this incentive advantage, arguing that agency compensation should not automatically rise simply because an advertiser increases its Google Ads budget.
Effective Management Cost Falls as Ad Spend Scales
A flat retainer can become increasingly economical as advertising expenditure grows, provided the original scope remains appropriate.
Consider a hypothetical $2,500 monthly management retainer:
| Monthly Ad Spend | Flat Agency Retainer | Effective Management Rate | Total Monthly Investment |
|---|---|---|---|
| $5,000 | $2,500 | 50.0% | $7,500 |
| $10,000 | $2,500 | 25.0% | $12,500 |
| $20,000 | $2,500 | 12.5% | $22,500 |
| $40,000 | $2,500 | 6.25% | $42,500 |
| $100,000 | $2,500 | 2.5% | $102,500 |
This illustrates why flat retainers can become financially attractive to scaling advertisers. However, it also exposes the model’s primary structural weakness: advertising expenditure can expand considerably without a corresponding increase in agency resources.
The Scope-Creep Problem
Flat retainers work best when the workload remains reasonably aligned with the agreed service scope.
A campaign growing from $10,000 to $40,000 per month does not automatically require four times as much agency labor. Nevertheless, growth can introduce substantially more complexity through additional campaigns, geographic markets, product categories, creative assets, conversion data, audience segments and reporting requirements.
| Scaling Event | Potential Agency Workload Impact |
|---|---|
| Higher Spend on Existing Campaigns | Low to Medium |
| Additional Campaigns | Medium |
| New Geographic Markets | Medium to High |
| New Product Categories | Medium to High |
| Additional Advertising Platforms | High |
| More Creative Testing | Medium to High |
| Advanced Offline Conversion Tracking | High |
| Multi-Market Reporting | High |
| Complex Shopping Feed Expansion | High |
This distinction is important. Ad spend itself is not necessarily an accurate proxy for workload. Account complexity is usually the more meaningful consideration.
When a Flat Retainer Becomes Unsustainable
The principal risk emerges when campaign complexity expands beyond the assumptions used to establish the original fee.
If an advertiser substantially increases campaign volume while expecting the same strategic attention for the original retainer, the agency’s effective compensation per unit of work declines.
| Account Development | Agency Fee | Workload | Commercial Sustainability |
|---|---|---|---|
| Stable Campaign Portfolio | Fixed | Stable | High |
| Higher Spend, Same Structure | Fixed | Slight Increase | High |
| Additional Campaigns | Fixed | Moderate Increase | Medium |
| New Markets and Channels | Fixed | Significant Increase | Low to Medium |
| Major Enterprise Expansion | Fixed | Very High | Low without Rescoping |
The likely consequence is not necessarily poorer service, but a requirement to renegotiate scope. Well-structured agency agreements therefore define what the retainer includes and identify conditions that trigger repricing.
What Should Be Included in a Google Ads Retainer?
A flat fee becomes meaningful only when the underlying deliverables are clearly documented.
| Service Area | Typical Retainer Consideration |
|---|---|
| Campaign Management | Usually included |
| Keyword Management | Usually included |
| Negative Keywords | Usually included |
| Bid and Budget Optimization | Usually included |
| Search Query Analysis | Usually included |
| Ad Copy Testing | Commonly included |
| Performance Max Management | Depends on scope |
| Shopping Feed Optimization | May cost additional |
| Conversion Tracking | Included or separately scoped |
| Landing Page CRO | Frequently limited or additional |
| Creative Production | Frequently separately scoped |
| CRM Integration | Usually dependent on complexity |
| Reporting | Usually included |
| Strategy Meetings | Often frequency-limited |
Advertisers should therefore compare the scope of work rather than comparing retainer prices alone. A $2,000 monthly retainer covering only basic campaign optimization cannot be directly compared with a $4,000 engagement that includes conversion tracking, creative strategy, landing-page optimization and advanced reporting.
Flat Retainer vs. Percentage of Ad Spend
The fundamental difference between these models is what causes the agency’s fee to increase.
| Pricing Factor | Flat Monthly Retainer | Percentage of Ad Spend |
|---|---|---|
| Fee Basis | Defined service scope | Monthly media expenditure |
| Monthly Predictability | High | Medium |
| Fee Automatically Rises With Spend | No | Yes |
| Effective Rate Falls as Spend Grows | Usually | Usually not without tiering |
| Scope Definition Importance | Very High | High |
| Scaling Flexibility | Medium | High |
| Incentive to Increase Ad Spend | Lower | Potentially higher |
| Risk of Scope Creep | Higher | Lower |
| Best Fit | Stable, clearly defined programs | Accounts where workload scales with spend |
Current PPC pricing guides recognize both structures as mainstream approaches, with flat retainers particularly suited to advertisers seeking predictable management costs.
Flat Retainer Pricing Should Be Scope-Based, Not Spend-Blind
A well-designed flat monthly Google Ads management fee should not simply ignore account growth. Instead, it should establish clear boundaries around the work covered by the retainer.
For example, pricing could be based on campaign count, geographic markets, advertising channels, product-feed complexity, reporting requirements, creative workload and conversion-tracking responsibilities.
| Retainer Driver | Low Complexity | Medium Complexity | High Complexity |
|---|---|---|---|
| Campaign Portfolio | Few campaigns | Multiple campaigns | Large portfolio |
| Geographic Coverage | Single market | Several regions | Multi-country |
| Conversion Tracking | Basic | Enhanced | CRM and offline attribution |
| Creative Requirements | Limited | Regular testing | Continuous production |
| Reporting | Standard | Custom dashboards | Executive and multi-market |
| Strategic Support | Monthly | Regular | Dedicated senior team |
When Flat Monthly Retainer Pricing Works Best
Flat-retainer Google Ads pricing is particularly attractive for advertisers with relatively stable campaign structures, predictable management requirements and a desire for transparent monthly costs.
It can also become highly cost-efficient for growing advertisers because the effective management percentage declines as media spend increases. However, that advantage remains sustainable only while campaign complexity stays within the agreed scope.
The strongest flat-retainer agreements therefore combine predictable pricing with clearly defined deliverables, service boundaries and predetermined conditions for scope adjustments. This protects advertisers from arbitrary fee increases while ensuring that the agency continues to have sufficient resources to manage the account effectively as the Google Ads program grows.
3. Hybrid Pricing Architectures
Hybrid pricing combines two or more Google Ads agency pricing mechanisms within the same commercial agreement. The most common structure combines a guaranteed monthly base retainer with a variable fee linked to advertising spend, account growth, or measurable performance.
Current 2026 PPC pricing guides identify hybrid retainers as a recognized alternative to pure flat-fee and percentage-of-spend pricing. One commonly cited structure is approximately $500 to $1,500 in base management fees plus a percentage of advertising expenditure above an agreed threshold.
Hybrid pricing attempts to solve two competing problems: agencies need sufficient baseline revenue to provide consistent strategic resources, while advertisers generally want management costs to scale more slowly than their media budgets.
| Hybrid Pricing Component | Primary Purpose | Advertiser Benefit | Agency Benefit |
|---|---|---|---|
| Base Retainer | Covers core management workload | Predictable baseline cost | Guaranteed minimum revenue |
| Spend-Based Variable Fee | Compensates for account scaling | Lower percentage than pure spend pricing | Revenue grows with account size |
| Tiered Rate | Reduces marginal fees at scale | Volume efficiency | Controlled revenue expansion |
| Performance Bonus | Rewards agreed outcomes | Stronger incentive alignment | Upside for superior performance |
| Scope Adjustment | Accounts for increased complexity | Transparent repricing | Protects delivery economics |
Base Retainer Plus Percentage of Ad Spend
One of the clearest hybrid structures combines a fixed monthly retainer with a reduced percentage applied above a predefined spending threshold.
A representative arrangement could be:
$1,000 monthly base fee + 10% of Google Ads spend above $5,000
The base retainer compensates the agency for campaign management, reporting, meetings, measurement and strategic oversight. The variable portion increases compensation only after the advertiser passes the agreed media threshold. Published 2026 PPC pricing examples specifically identify this type of $1,000 base plus 10% above $5,000 arrangement as a practical hybrid model.
| Monthly Ad Spend | Base Retainer | Spend Above $5,000 | 10% Variable Fee | Total Agency Fee |
|---|---|---|---|---|
| $5,000 | $1,000 | $0 | $0 | $1,000 |
| $10,000 | $1,000 | $5,000 | $500 | $1,500 |
| $20,000 | $1,000 | $15,000 | $1,500 | $2,500 |
| $30,000 | $1,000 | $25,000 | $2,500 | $3,500 |
| $50,000 | $1,000 | $45,000 | $4,500 | $5,500 |
| $100,000 | $1,000 | $95,000 | $9,500 | $10,500 |
This creates a smoother cost curve than charging a full percentage against every dollar of media expenditure.
Why Hybrid Pricing Can Work for Growing Google Ads Accounts
A pure percentage model can become expensive as advertising expenditure increases, while a pure flat retainer can become economically difficult for an agency when account complexity expands substantially.
Hybrid pricing creates a middle ground.
| Pricing Model | Small Account Protection | Scales With Growth | Cost Predictability | Incentive Alignment |
|---|---|---|---|---|
| Flat Retainer | High | Low | Very High | High toward efficiency |
| Percentage of Spend | Usually through minimum fee | Very High | Medium | Potential spend incentive |
| Base + Percentage | High | High | High | Medium to High |
| Tiered Percentage | Medium | High | Medium to High | Better at scale |
| Base + Performance | High | Performance-dependent | Medium | Potentially High |
This flexibility makes hybrid arrangements particularly relevant for growth-stage and mid-market advertisers whose Google Ads budgets may change significantly throughout the year.
Tiered Percentage Pricing
Another hybrid architecture uses declining percentage tiers.
Instead of charging the same percentage against the entire advertising budget, progressively lower marginal rates can apply as expenditure crosses predetermined thresholds.
Consider the following illustrative structure:
20% on the first $10,000
15% on the next $15,000
10% on expenditure above $25,000
| Spend Band | Marginal Rate | Spend Within Band at $30,000 Total Spend | Management Fee |
|---|---|---|---|
| First $10,000 | 20% | $10,000 | $2,000 |
| $10,001 – $25,000 | 15% | $15,000 | $2,250 |
| Above $25,000 | 10% | $5,000 | $500 |
| Total | Effective Rate: 15.83% | $30,000 | $4,750 |
The $4,750 calculation is correct when the percentages are applied marginally to each spending band.
This distinction matters because tiered pricing can alternatively mean that the advertiser’s entire account moves into a new percentage once a threshold is reached. Contracts should explicitly identify whether rates are marginal or applied to total monthly spend.
Tiered Pricing vs. Fixed Percentage Pricing
Declining tiers recognize that management workload does not necessarily rise dollar-for-dollar with advertising expenditure.
For example, increasing an established campaign from $50,000 to $60,000 per month does not automatically create the same incremental workload as launching an entirely new $10,000 campaign across a different country.
| Pricing Characteristic | Fixed Percentage | Declining Tier Structure |
|---|---|---|
| Rate as Spend Increases | Remains constant | Progressively decreases |
| Management Cost Growth | Linear | Slower at higher budgets |
| Volume Discount | No | Yes |
| Calculation Complexity | Low | Medium |
| Enterprise Suitability | Medium | High |
| Protection Against Excessive Scaling Fees | Low | Higher |
Published 2026 PPC pricing analysis similarly suggests that effective management percentages generally decline at higher media-spend levels because workload does not scale proportionately with every additional advertising dollar.
Base Retainer Plus Performance Bonus
A second major hybrid architecture combines a guaranteed monthly retainer with performance-linked compensation.
Instead of connecting the variable fee primarily to media expenditure, the additional payment depends on agreed business outcomes.
| Performance Metric | Possible Bonus Structure | Primary Advantage | Primary Measurement Risk |
|---|---|---|---|
| Target CPA | Bonus below agreed CPA | Acquisition efficiency | Lead quality differences |
| ROAS | Bonus above target ROAS | Revenue efficiency | Attribution accuracy |
| Qualified Leads | Payment per qualified lead | Lead-generation alignment | Qualification disputes |
| New Customers | Fee per acquired customer | Direct commercial alignment | CRM attribution |
| Revenue Growth | Percentage of incremental revenue | Strong growth alignment | Baseline calculation |
| Conversion Growth | Bonus above agreed threshold | Encourages optimization | Conversion quality |
Current PPC pricing guides describe arrangements involving a lower base fee combined with performance incentives, commonly linked to leads, revenue, conversions, or return on advertising spend. Pure performance pricing is less common because campaign results can also depend on factors outside the agency’s direct control, including pricing, landing pages, inventory, sales processes and offer quality.
How Performance Hybrid Pricing Could Work
Consider an illustrative agreement with:
$2,500 monthly base retainer
$500 bonus when CPA remains below $50
Additional $500 bonus when ROAS exceeds 5.0x
| Monthly Result | Base Fee | CPA Bonus | ROAS Bonus | Total Agency Fee |
|---|---|---|---|---|
| CPA $65 / ROAS 3.5x | $2,500 | $0 | $0 | $2,500 |
| CPA $45 / ROAS 4.2x | $2,500 | $500 | $0 | $3,000 |
| CPA $55 / ROAS 5.5x | $2,500 | $0 | $500 | $3,000 |
| CPA $40 / ROAS 6.0x | $2,500 | $500 | $500 | $3,500 |
This approach protects the agency’s baseline economics while reserving additional compensation for stronger results.
The Attribution Challenge
Performance-based hybrid pricing requires substantially stronger measurement than traditional retainer agreements.
Before implementing performance incentives, both parties should establish exactly how conversions, customers and revenue will be attributed.
| Measurement Issue | Contractual Definition Required |
|---|---|
| Conversion Window | How long Google Ads receives conversion credit |
| Lead Qualification | What constitutes a valid qualified lead |
| Revenue Attribution | Which revenue can be attributed to paid advertising |
| Repeat Customers | Whether returning customers qualify |
| Offline Sales | How CRM conversions are connected to campaigns |
| Refunds | Whether refunded transactions reduce attributed revenue |
| Cancellations | How cancelled orders or appointments are treated |
| Attribution Model | Which measurement methodology determines credit |
| Reporting Source | Which analytics or CRM platform is authoritative |
Without these definitions, performance bonuses can generate disputes even when campaigns themselves are performing successfully.
Hybrid Pricing Risk Matrix
Hybrid pricing is not automatically superior simply because it combines multiple pricing mechanisms. Poorly designed hybrid contracts can become more complicated and expensive than either a flat retainer or percentage model.
| Risk | Advertiser Exposure | Agency Exposure | Recommended Control |
|---|---|---|---|
| Excessive Variable Fees | High | Low | Establish fee caps or declining tiers |
| Scope Creep | Medium | High | Define campaign and market boundaries |
| Attribution Disputes | High | High | Establish measurement methodology |
| Rapid Spend Growth | Medium | Medium | Use predetermined spending tiers |
| Performance Volatility | Medium | High | Maintain reasonable base retainer |
| Unclear Fee Calculation | High | Medium | Include worked billing examples |
| KPI Manipulation | High | High | Use business-quality metrics |
| Changing Business Conditions | Medium | Medium | Schedule periodic commercial reviews |
When Hybrid Google Ads Pricing Works Best
Hybrid Google Ads agency pricing is particularly suitable for advertisers expecting meaningful growth but seeking greater cost control than a traditional percentage-of-spend agreement provides.
| Advertiser Profile | Hybrid Suitability | Preferred Structure |
|---|---|---|
| Small Stable Advertiser | Medium | Flat retainer may be simpler |
| Growing SMB | High | Base + reduced percentage |
| Scaling E-Commerce Brand | High | Base + tiered percentage |
| Lead Generation Business | High | Base + qualified-lead incentive |
| Mature Mid-Market Advertiser | High | Tiered retainer or performance hybrid |
| Enterprise Advertiser | High | Custom retainer + declining tiers |
| Poor Conversion Tracking | Low | Avoid performance components |
| Highly Seasonal Advertiser | High | Base + variable structure |
What Advertisers Should Negotiate
The strongest hybrid pricing agreements make every variable component mathematically transparent before campaigns begin.
Advertisers should establish the base retainer, spending threshold, applicable percentage, whether tiers operate marginally or against total spend, maximum monthly management fee, included services, performance definitions and circumstances that trigger repricing.
A hybrid model can consequently offer a practical compromise between predictable Google Ads management costs and scalable agency compensation. Its greatest advantage is flexibility: the agency receives sufficient baseline compensation to maintain service quality, while the advertiser can avoid paying an unchanged percentage against increasingly large media budgets.
When performance incentives are added, the model can create even stronger alignment, but only when conversion tracking, CRM data, attribution rules and KPI definitions are sufficiently reliable to determine objectively whether the agreed performance targets have actually been achieved.
4. Performance-Based and Outcome-Linked Models
What Is Performance-Based Google Ads Agency Pricing?
Performance-based Google Ads pricing links some or all of an agency’s compensation to measurable business outcomes rather than solely to advertising spend, hours worked, or a fixed monthly management fee.
Common outcomes include qualified leads, customer acquisitions, completed sales, attributed revenue, target CPA, ROAS, or improvements above an agreed performance baseline. Current 2026 PPC pricing research indicates that pure performance arrangements remain relatively uncommon; hybrid structures combining a base fee with an outcome-linked incentive are generally more practical because campaign results depend partly on factors outside an agency’s direct control.
| Performance Pricing Model | Agency Compensation Basis | Typical Application | Primary Risk |
|---|---|---|---|
| Pay Per Lead | Qualified leads generated | B2B and local lead generation | Lead-quality disputes |
| Pay Per Acquisition | New customers or completed conversions | E-commerce and subscription businesses | Attribution complexity |
| Revenue Share | Percentage of attributed revenue | Direct-response e-commerce | Revenue attribution disputes |
| CPA Bonus | Bonus for achieving or beating CPA targets | Mature acquisition programs | Incentive to prioritize cheaper conversions |
| ROAS Bonus | Additional fee above ROAS threshold | E-commerce | Margin and attribution differences |
| Retainer + Performance Bonus | Base fee plus outcome-linked compensation | Growth and enterprise accounts | More complex contract structure |
Pay-Per-Lead Pricing
Under a pay-per-lead arrangement, compensation depends on the number of leads satisfying predefined qualification criteria.
Published 2026 PPC benchmarks indicate approximately $50 to $500 per lead depending on industry and lead value. However, there is no universal Google Ads pay-per-lead rate because the economics of a qualified enterprise software lead can differ dramatically from those of a local service enquiry.
| Lead Pricing Factor | Lower Cost Tendency | Higher Cost Tendency |
|---|---|---|
| Customer Lifetime Value | Low | High |
| Purchase Complexity | Simple | Complex |
| Sales Cycle | Short | Long |
| Lead Qualification | Basic enquiry | Sales-qualified prospect |
| Geographic Competition | Low | High |
| Commercial Intent | Moderate | Very High |
| Required Lead Volume | High-volume market | Limited specialist market |
For example, an agency charging $150 per qualified lead and delivering 100 accepted leads would earn $15,000 in performance fees.
The crucial term is “qualified.” Without an explicit definition, agencies can be incentivized to maximize lead volume rather than actual sales opportunities.
Lead Volume vs. Lead Quality
Performance-based compensation can produce unintended optimization behavior when the paid outcome does not accurately represent business value.
| Agency Is Paid For | Likely Optimization Priority | Potential Advertiser Risk |
|---|---|---|
| Form Submissions | Maximum conversions | Low-intent enquiries |
| Qualified Leads | Qualification and volume | Qualification disputes |
| Booked Meetings | Appointment generation | No-shows |
| Sales Opportunities | Pipeline quality | Longer verification cycle |
| New Customers | Completed acquisitions | Attribution disputes |
| Gross Profit | Profitable customers | Complex financial integration |
This explains why sophisticated performance agreements increasingly define downstream outcomes rather than relying exclusively on top-of-funnel conversion volume.
Revenue-Share Pricing
Revenue-share pricing gives the agency a predetermined percentage of revenue attributed to its Google Ads activity.
For example:
Agency Performance Fee = Attributed Google Ads Revenue × Revenue-Share Percentage
Published 2026 sources show substantial variation in revenue-share arrangements. One contemporary PPC pricing analysis cites approximately 5% to 15% of attributed revenue, while broader performance-marketing agreements can vary considerably according to industry, margins, attribution methodology, and the amount of commercial risk assumed by the agency.
| Attributed Monthly Revenue | 5% Revenue Share | 8% Revenue Share | 10% Revenue Share |
|---|---|---|---|
| $50,000 | $2,500 | $4,000 | $5,000 |
| $100,000 | $5,000 | $8,000 | $10,000 |
| $250,000 | $12,500 | $20,000 | $25,000 |
| $500,000 | $25,000 | $40,000 | $50,000 |
| $1,000,000 | $50,000 | $80,000 | $100,000 |
Revenue share can provide strong alignment when transactions are directly measurable. However, it becomes substantially more difficult in businesses involving long sales cycles, offline purchases, multiple marketing touchpoints, repeat customers, or significant brand-driven demand.
Gross Revenue Is Not the Same as Profit
Advertisers considering revenue-share pricing should determine whether the agency is rewarded for revenue or economically valuable growth.
Two campaigns generating identical revenue can produce radically different profits.
| Metric | Campaign A | Campaign B |
|---|---|---|
| Google Ads Spend | $20,000 | $40,000 |
| Attributed Revenue | $100,000 | $100,000 |
| ROAS | 5.0x | 2.5x |
| Agency Revenue Share at 8% | $8,000 | $8,000 |
| Advertising Efficiency | Higher | Lower |
A revenue-share contract based exclusively on gross sales could therefore compensate an agency equally despite substantially different advertising efficiency.
For businesses with significant cost-of-goods, fulfillment, returns, discounts, or variable margins, contribution margin, new-customer profitability, CAC, or incremental revenue may provide stronger performance measures.
Retainer Plus Performance Bonus
A hybrid performance structure is frequently more sustainable than pure pay-for-results pricing.
The agency receives a base retainer sufficient to support campaign management and then earns additional compensation for exceeding predetermined performance thresholds. Current 2026 pricing guides repeatedly identify this structure as a practical way of combining financial stability with performance alignment.
| Component | Example Structure | Purpose |
|---|---|---|
| Base Retainer | $3,000 per month | Covers core management resources |
| Target CPA | $75 | Establishes efficiency benchmark |
| CPA Bonus | $750 below $65 | Rewards acquisition efficiency |
| Target ROAS | 4.0x | Establishes revenue benchmark |
| ROAS Bonus | $1,000 above 5.0x | Rewards profitable scaling |
| Maximum Bonus | $2,000 | Controls advertiser exposure |
This approach prevents the agency from carrying the entire financial risk while still providing meaningful upside for exceptional performance.
The Attribution Requirement
Attribution is the central operational challenge of performance-based Google Ads pricing.
Because agency compensation depends on recorded outcomes, both parties need an agreed source of truth. Current performance-pricing guidance emphasizes clear conversion definitions, first-party measurement, CRM integration, and stronger tracking infrastructure before outcome-based compensation is introduced.
| Attribution Requirement | Contractual Question |
|---|---|
| Qualified Lead Definition | Exactly what characteristics make a lead billable? |
| Attribution Window | How long after an ad interaction can a conversion qualify? |
| CRM Authority | Which system determines whether a lead became a customer? |
| Existing Customers | Are repeat purchases included or excluded? |
| Refunds | Are refunded transactions removed from revenue calculations? |
| Cancellations | Do cancelled orders remain billable? |
| Offline Sales | How are phone and offline transactions attributed? |
| Cross-Channel Conversions | How is credit divided across multiple marketing channels? |
| Revenue Source | Which financial system determines final attributed revenue? |
| Performance Baseline | Against which historical period is improvement measured? |
Why Server-Side and CRM Measurement Matter
Platform-reported conversions alone may not provide sufficient evidence for a contract in which significant agency compensation depends on results.
A stronger measurement architecture can connect Google Ads interactions with first-party conversion data, CRM outcomes, qualified-lead status, completed transactions, refunds, and offline sales. Contemporary PPC pricing guidance specifically identifies server-side tracking and unified revenue data as important foundations for defensible performance compensation.
| Measurement Maturity | Performance Pricing Suitability |
|---|---|
| Basic Google Ads Conversion Tracking | Low to Medium |
| Google Ads + Analytics | Medium |
| Enhanced First-Party Tracking | Medium to High |
| CRM-Integrated Conversion Tracking | High |
| Server-Side + CRM + Revenue Data | Very High |
| Unreliable or Incomplete Tracking | Very Low |
The Agency Control Problem
Performance pricing appears to create perfect incentive alignment, but an agency rarely controls every variable determining commercial performance.
Google Ads management can influence targeting, bidding, campaign structure, advertising creative, keyword selection, budget allocation and traffic quality. However, the advertiser typically controls pricing, inventory, website performance, product competitiveness, sales response times, customer service and fulfillment.
Current 2026 pricing analyses consistently identify this division of control as a major reason pure performance contracts are difficult to sustain.
| Performance Variable | Agency Control | Advertiser Control |
|---|---|---|
| Keyword Strategy | High | Low |
| Bid Strategy | High | Low |
| Audience Targeting | High | Low |
| Ad Creative | Medium to High | Medium |
| Landing Page | Varies | Usually High |
| Product Pricing | Low | High |
| Inventory | Low | High |
| Sales Team Performance | Low | High |
| Lead Response Time | Low | High |
| Fulfillment | Low | High |
| Customer Retention | Low | High |
Consequently, agencies accepting substantial performance risk may require greater control over landing pages, conversion optimization, creative production, tracking, or other parts of the customer acquisition funnel.
Potential Incentive Problems
Outcome-linked pricing does not automatically eliminate conflicts of interest. Instead, it changes which behaviors are financially rewarded.
| Pricing Metric | Desired Behavior | Possible Unintended Behavior |
|---|---|---|
| Pay Per Lead | Generate leads | Prioritize volume over quality |
| Pay Per Sale | Generate customers | Focus on easiest conversions |
| Revenue Share | Increase revenue | Prioritize gross sales over margin |
| CPA Target | Lower acquisition cost | Reduce scale to protect CPA |
| ROAS Target | Improve efficiency | Avoid expansion into less mature audiences |
| Conversion Growth | Increase conversions | Optimize low-value conversion actions |
The most effective contracts therefore use metrics that approximate genuine business value rather than superficial advertising activity.
Performance Pricing Suitability Matrix
| Business Model | Suitability | Reason |
|---|---|---|
| Direct-Response E-Commerce | High | Sales and revenue can often be measured quickly |
| Subscription Business | High | CAC and customer value can be quantified |
| Local Lead Generation | Medium to High | Qualified leads can be clearly defined |
| B2B SaaS | Medium | Long sales cycles complicate attribution |
| Enterprise B2B | Low to Medium | Multi-touch journeys make attribution difficult |
| Brand Advertising | Low | Outcomes are difficult to assign to individual campaigns |
| Offline Sales Business | Medium | Requires strong CRM and offline conversion infrastructure |
| Business With Poor Tracking | Very Low | Performance compensation cannot be reliably calculated |
When Performance-Based Google Ads Pricing Makes Sense
Performance-based Google Ads agency pricing works best when the advertiser has measurable unit economics, reliable first-party data, clearly defined conversion events, robust CRM integration, and sufficient transaction volume to distinguish genuine performance improvements from short-term volatility.
Pure pay-for-results arrangements may appear to offer maximum advertiser protection, but they transfer considerable commercial risk to the agency and can create undesirable optimization incentives. For this reason, contemporary PPC pricing guidance increasingly favors a hybrid structure in which a reasonable base retainer funds ongoing management while additional compensation is earned for exceeding clearly documented business-performance thresholds.
The most important consideration is therefore not whether a Google Ads agency claims to offer “performance-based pricing.” It is whether the contract defines performance in a way that corresponds with profitable business growth. Qualified leads, new-customer CAC, contribution margin, incremental revenue and verified customer acquisitions generally provide stronger commercial alignment than clicks, raw conversions, media spend, or gross lead volume alone.
5. Hourly Rates and Project-Based Google Ads Engagements
Hourly and project-based pricing remains an important part of the Google Ads agency pricing landscape in 2026, particularly for account audits, campaign builds, conversion-tracking projects, strategic consulting, training, troubleshooting, and other assignments with clearly defined boundaries.
Unlike monthly retainers, these engagements allow advertisers to purchase specialist expertise without committing to ongoing agency management. Current market benchmarks show substantial variation by provider: freelance PPC specialists can start around $20–$45 per hour on major freelance marketplaces, experienced independent specialists commonly reach $50–$150 per hour, while established agencies and senior consultants frequently operate around $100–$250 or more per hour.
Google Ads Hourly Rates in 2026
The provider’s experience, geographic market, specialization, account complexity, and responsibility level all influence the final hourly rate. Consequently, advertisers should treat broad hourly benchmarks as planning ranges rather than standardized industry prices.
| Professional Provider Tier | Indicative Hourly Rate | Typical Project Range | Common Deliverables |
|---|---|---|---|
| Entry-Level Freelancer | $20 – $45 / hour | $150 – $500+ | Basic campaign setup, keyword research, simple ad copy |
| Experienced PPC Freelancer | $50 – $100 / hour | $500 – $1,500+ | Campaign builds, optimization, tracking and audits |
| Senior PPC Specialist | $100 – $175+ / hour | $1,000 – $3,000+ | Advanced audits, strategy, attribution and restructuring |
| Established PPC Agency | $100 – $199+ / hour | $2,000 – $10,000+ | Complex builds, multi-campaign strategy and advanced measurement |
| Specialist Consultant | $150 – $250+ / hour | Custom | Enterprise strategy, measurement architecture and senior advisory |
These ranges are supported by several 2026 market references. Clutch reports that PPC agencies listed on its platform commonly charge approximately $100–$149 per hour, while current Google Ads pricing research places consulting and specialist rates around $75–$250 or more depending on expertise and scope.
Freelancer vs. Agency Hourly Pricing
Freelancers generally operate with lower overhead than established agencies and can therefore provide economical access to specialist Google Ads expertise.
Current freelance-marketplace data places PPC specialists around $20–$45 per hour overall, with example project costs ranging from approximately $160–$900 for PPC audits and $300–$1,350 for campaign setup and launch. More experienced independent consultants can command substantially higher rates.
| Provider Type | Relative Cost | Resource Depth | Best Application |
|---|---|---|---|
| Junior Freelancer | Low | Limited | Simple campaign tasks |
| Experienced Freelancer | Low to Medium | Individual specialist | SMB accounts and targeted projects |
| Senior Consultant | Medium to High | Deep individual expertise | Audits and strategic problems |
| Specialist PPC Agency | High | Multiple specialists | Complex campaign projects |
| Enterprise Agency | Very High | Cross-functional teams | Large-scale implementations |
Project-Based Google Ads Pricing
Project-based pricing converts an estimated workload into a predetermined fee for a defined deliverable.
Instead of billing every hour separately, an agency might quote a fixed amount for an account audit, campaign rebuild, tracking implementation, product-feed restructuring, or new-market launch.
| Google Ads Project | Indicative 2026 Cost | Typical Deliverables |
|---|---|---|
| Basic Account Audit | $160 – $900 | Account review, wasted-spend analysis and recommendations |
| Advanced Account Audit | $500 – $3,000+ | Deep campaign, tracking and strategic analysis |
| Campaign Setup and Launch | $300 – $1,350+ | Keywords, campaign structure, ads and conversion setup |
| Landing Page and Ad Optimization | $200 – $1,125+ | Copy analysis, CRO recommendations and testing plan |
| Full-Funnel Paid Media Strategy | $600 – $2,700+ | Channel strategy, budget allocation and measurement |
| Enterprise Campaign Build | $2,500 – $10,000+ | Complex architecture, integrations and advanced tracking |
These ranges overlap considerably because an audit of a small local Search account is fundamentally different from auditing an enterprise account containing Search, Shopping, Performance Max, international campaigns, offline conversions, and sophisticated attribution.
Google Ads Account Audit Pricing
Account audits are particularly well suited to project-based pricing because they have a definable beginning, methodology, and final deliverable.
A professional Google Ads audit typically examines campaign architecture, search terms, keywords, match types, bidding strategies, budgets, conversion tracking, advertising assets, audience signals, landing pages, geographic targeting, and wasted expenditure.
| Audit Level | Typical Complexity | Indicative Price |
|---|---|---|
| Basic Diagnostic Audit | Small Search account | $160 – $500 |
| Standard PPC Audit | Multiple active campaigns | $500 – $1,000 |
| Advanced Audit | Search, Shopping or Performance Max | $1,000 – $2,500 |
| Senior Strategic Audit | Large or technically complex account | $1,500 – $3,000+ |
| Enterprise Assessment | Multi-market or multi-channel environment | Custom |
Current marketplace benchmarks place intermediate PPC account audits around $160–$900, while specialist market references indicate that deeper senior-level Google Ads audits can reach approximately $1,500–$3,000.
Campaign Setup and Onboarding Fees
New Google Ads accounts can require considerable upfront work before ongoing optimization begins. Agencies may therefore separate initial setup or onboarding from recurring management fees.
The work can include keyword research, account architecture, conversion tracking, campaign configuration, audience development, advertising copy, Performance Max assets, Shopping feeds, analytics configuration, and quality assurance.
| Setup Complexity | Typical Requirements | Pricing Implication |
|---|---|---|
| Basic | Single-market Search campaign | Lower project fee |
| Moderate | Multiple campaigns and conversions | Medium project fee |
| Advanced | Search plus Performance Max or Shopping | Higher project fee |
| Complex | CRM and offline conversion integration | Specialist pricing |
| Enterprise | Multiple markets, feeds and measurement systems | Custom implementation fee |
One 2026 pricing analysis estimates that a new PPC account build can involve roughly 15–25 hours of upfront work, while other published agency benchmarks place sophisticated onboarding and setup fees considerably higher depending on complexity.
Why Hourly Pricing Works for Specialist Tasks
Hourly billing can be economically efficient when the advertiser needs expertise rather than continuous campaign execution.
| Requirement | Hourly Pricing Suitability |
|---|---|
| Second Opinion on Existing Account | Very High |
| Strategic Consultation | Very High |
| Google Ads Training | Very High |
| Tracking Troubleshooting | High |
| Account Audit | High |
| Short-Term Campaign Cleanup | High |
| Complete Campaign Build | Medium |
| Continuous Optimization | Low to Medium |
| Long-Term Account Management | Low |
This explains why hourly Google Ads pricing is more commonly associated with consulting, audits, training, cleanup work, and strategic support than comprehensive ongoing management.
The Problem With Uncapped Hourly Billing
The primary disadvantage of hourly pricing is uncertainty.
An apparently economical $100 hourly rate can become expensive when a loosely defined project expands from 10 hours to 30 hours.
| Scenario | Hourly Rate | Hours Required | Final Cost |
|---|---|---|---|
| Small Audit | $100 | 5 | $500 |
| Campaign Review | $100 | 10 | $1,000 |
| Account Rebuild | $100 | 20 | $2,000 |
| Complex Implementation | $100 | 40 | $4,000 |
| Enterprise Project | $100 | 80 | $8,000 |
Project pricing transfers more of this estimation risk to the provider. The advertiser knows the agreed cost in advance, while the agency assumes responsibility for accurately estimating the resources necessary to complete the specified deliverables.
Hourly vs. Fixed Project Pricing
| Pricing Factor | Hourly Engagement | Fixed Project Fee |
|---|---|---|
| Cost Predictability | Low to Medium | High |
| Scope Flexibility | High | Medium |
| Billing Transparency | High | High |
| Overrun Risk for Advertiser | High | Lower |
| Agency Estimation Risk | Low | Higher |
| Best for Consulting | Excellent | Good |
| Best for Defined Audit | Good | Excellent |
| Best for Campaign Build | Medium | Excellent |
| Best for Ongoing Management | Limited | Limited |
What Advertisers Should Define Before Starting
Whether an engagement is hourly or project-based, scope definition remains critical.
| Contract Element | Recommended Clarification |
|---|---|
| Hourly Rate | Exact rate and applicable specialists |
| Estimated Hours | Expected workload before work begins |
| Maximum Hours | Spending cap requiring approval to exceed |
| Deliverables | Exact outputs expected from the project |
| Revisions | Number of revision rounds included |
| Tracking | Whether conversion configuration is included |
| Creative | Whether advertisements and assets are included |
| Implementation | Whether recommendations will actually be implemented |
| Timeline | Expected completion period |
| Post-Project Support | Whether follow-up assistance is included |
When Hourly or Project Pricing Makes the Most Sense
Hourly Google Ads pricing is most appropriate when the scope cannot be completely predicted but the advertiser requires targeted specialist expertise. Strategic consulting, troubleshooting, training, technical measurement problems, and second-opinion reviews are strong examples.
Fixed project pricing is generally better when the deliverable can be clearly defined in advance. Account audits, campaign builds, migrations, tracking implementations, and restructuring projects naturally fit this approach.
For advertisers comparing Google Ads agency pricing in 2026, hourly rates should therefore not be evaluated in isolation. A $200-per-hour senior specialist who resolves a complex tracking problem in three hours may ultimately cost less than a $50-per-hour provider requiring several days to diagnose the same issue.
The more useful comparison is total project cost, expected expertise, scope of work, implementation responsibility, and the measurable business value produced by the engagement.
6. Quantitative Breakeven Modeling for Google Ads Agency Pricing
Why Breakeven Analysis Matters
Comparing Google Ads agency pricing models solely by their headline rates can produce misleading conclusions. A 12% management fee may appear inexpensive beside a $3,500 monthly retainer at lower advertising budgets, yet become substantially more expensive once media spending scales.
Current 2026 PPC pricing research generally places percentage-of-spend management around 10% to 20%, while flat retainers commonly range from approximately $1,500 to $10,000 or more depending on account complexity. Hybrid structures combining a base retainer with a smaller variable percentage are also widely offered.
For advertisers, breakeven modeling provides a straightforward way to identify the point at which one pricing structure becomes financially preferable to another.
Calculating the Breakeven Monthly Ad Spend
When comparing a fixed monthly retainer against a percentage-of-spend agreement, the crossover point can be calculated as:
Breakeven Monthly Ad Spend = Flat Monthly Retainer ÷ Percentage Management Rate
Consider an agency offering either:
Flat monthly retainer: $3,500
Percentage management fee: 12%
The calculation becomes:
$3,500 ÷ 0.12 = $29,166.67
The approximate breakeven point is therefore $29,167 in monthly Google Ads spend.
| Monthly Ad Spend | 12% Management Fee | $3,500 Flat Retainer | Lower-Cost Model |
|---|---|---|---|
| $10,000 | $1,200 | $3,500 | Percentage |
| $20,000 | $2,400 | $3,500 | Percentage |
| $25,000 | $3,000 | $3,500 | Percentage |
| $29,167 | $3,500 | $3,500 | Breakeven |
| $40,000 | $4,800 | $3,500 | Flat Retainer |
| $50,000 | $6,000 | $3,500 | Flat Retainer |
| $100,000 | $12,000 | $3,500 | Flat Retainer |
Below approximately $29,167, the 12% model has the lower nominal management fee. Above this threshold, the $3,500 flat retainer becomes cheaper, assuming both arrangements provide an equivalent scope and level of service.
This qualification is critical because current pricing research emphasizes that campaign complexity, included services, and workload can matter as much as media spend when evaluating agency costs.
Breakeven Thresholds at Different Percentage Rates
The crossover point changes significantly depending on the percentage charged.
Using the same $3,500 monthly retainer:
| Percentage Management Rate | Breakeven Monthly Ad Spend |
|---|---|
| 8% | $43,750 |
| 10% | $35,000 |
| 12% | $29,167 |
| 15% | $23,333 |
| 18% | $19,444 |
| 20% | $17,500 |
This demonstrates why advertisers should convert competing proposals into actual monthly dollar costs rather than comparing percentages and retainers independently.
Comparative Financial Scenarios
The following scenarios illustrate how four hypothetical pricing structures behave as Google Ads investment scales.
For consistency, the tiered model uses:
20% on the first $10,000
15% on the next $15,000
10% on spend above $25,000
The hybrid model uses illustrative base retainers and performance bonuses appropriate to each account tier. These figures are modeling assumptions rather than universal market prices.
| Ad Spend Scenario | Flat Retainer | Pure Percentage at 15% | Tiered Percentage | Hybrid Base + Performance |
|---|---|---|---|---|
| Small: $5,000 | $2,500 | $750 | $1,000 | $2,000 |
| Mid-Market: $15,000 | $4,500 | $2,250 | $2,750 | $3,500 |
| Enterprise: $50,000 | $8,000 | $7,500 | $6,750 | $6,000 |
| High-Volume: $100,000 | $12,000 | $15,000 | $11,750 | $11,000 |
These scenarios reflect the broader economics described in current PPC pricing research: percentage models can remain comparatively inexpensive at lower budgets, while declining tiers, negotiated retainers, and hybrid structures can become increasingly attractive as media investment grows.
Small Account Scenario: $5,000 Monthly Ad Spend
At $5,000 in monthly media expenditure, a 15% management fee produces an agency cost of only $750.
| Pricing Model | Monthly Agency Fee | Effective Fee as % of Ad Spend |
|---|---|---|
| Flat Retainer | $2,500 | 50.0% |
| 15% of Spend | $750 | 15.0% |
| Tiered Percentage | $1,000 | 20.0% |
| Hybrid | $2,000 | 40.0% |
Under these assumptions, percentage pricing is $1,750 cheaper than the flat retainer every month, equivalent to $21,000 annually.
However, real agency contracts frequently impose minimum management fees on smaller accounts. The theoretical $750 fee may therefore not be available in practice. Current industry sources specifically note that percentage agreements often contain minimum monthly floors.
Mid-Market Scenario: $15,000 Monthly Ad Spend
At $15,000 per month, the pure 15% model remains the lowest-cost option in this hypothetical comparison.
| Pricing Model | Monthly Agency Fee | Annual Agency Cost |
|---|---|---|
| Flat Retainer | $4,500 | $54,000 |
| 15% of Spend | $2,250 | $27,000 |
| Tiered Percentage | $2,750 | $33,000 |
| Hybrid | $3,500 | $42,000 |
The percentage arrangement produces a $2,250 monthly saving relative to the $4,500 retainer, or $27,000 annually.
At this spending level, advertisers should therefore determine whether the more expensive retainer contains additional services such as creative production, conversion tracking, landing-page optimization, reporting, or strategic consulting. Comparing fees without normalizing scope can create a false comparison.
Enterprise Scenario: $50,000 Monthly Ad Spend
The economics begin changing materially at higher spending levels.
| Pricing Model | Monthly Agency Fee | Annual Agency Cost | Effective Rate |
|---|---|---|---|
| Flat Retainer | $8,000 | $96,000 | 16.0% |
| 15% of Spend | $7,500 | $90,000 | 15.0% |
| Tiered Percentage | $6,750 | $81,000 | 13.5% |
| Hybrid | $6,000 | $72,000 | 12.0% |
Under the assumptions used here, the hybrid model becomes the least expensive at $6,000 per month, followed by the declining tier structure at $6,750.
This is consistent with current market evidence showing that higher-spending advertisers frequently negotiate lower percentage rates and that hybrid arrangements can use smaller variable percentages above predefined spending thresholds.
High-Volume Scenario: $100,000 Monthly Ad Spend
At $100,000 per month, relatively small differences in management percentages translate into substantial annual dollar differences.
| Pricing Model | Monthly Agency Fee | Annual Agency Cost | Effective Rate |
|---|---|---|---|
| Flat Retainer | $12,000 | $144,000 | 12.0% |
| 15% of Spend | $15,000 | $180,000 | 15.0% |
| Tiered Percentage | $11,750 | $141,000 | 11.75% |
| Hybrid | $11,000 | $132,000 | 11.0% |
The flat retainer costs $3,000 less per month than the pure 15% arrangement, generating a nominal annual saving of $36,000.
The tiered structure produces an even lower management cost of $11,750, while the hypothetical hybrid arrangement reaches $11,000.
How the Tiered Calculation Works
Tiered pricing deserves particular attention because advertisers can easily miscalculate it.
For $100,000 of monthly spend under the illustrative marginal structure:
| Spending Band | Amount Within Tier | Rate | Agency Fee |
|---|---|---|---|
| First $10,000 | $10,000 | 20% | $2,000 |
| Next $15,000 | $15,000 | 15% | $2,250 |
| Remaining $75,000 | $75,000 | 10% | $7,500 |
| Total | $100,000 | 11.75% Effective | $11,750 |
The percentages apply only to the expenditure falling inside each respective tier. The effective management rate therefore declines as the advertiser scales.
Advertisers should verify whether an agency’s quoted tiers operate marginally in this manner or whether crossing a threshold causes a new percentage to apply to the entire monthly budget.
Annual Cost Amplifies Small Pricing Differences
Monthly fee differences can appear relatively modest until they are annualized.
| Monthly Fee Difference | Annual Financial Impact |
|---|---|
| $500 | $6,000 |
| $1,000 | $12,000 |
| $2,000 | $24,000 |
| $3,000 | $36,000 |
| $5,000 | $60,000 |
| $10,000 | $120,000 |
For high-spend advertisers, negotiating the pricing architecture can therefore have a meaningful impact on overall paid-media economics.
Management Fee Should Be Evaluated Against Total Acquisition Economics
The cheapest agency fee is not necessarily the most economically efficient choice.
Consider two agencies managing the same $100,000 monthly Google Ads budget:
| Financial Metric | Agency A | Agency B |
|---|---|---|
| Monthly Ad Spend | $100,000 | $100,000 |
| Management Fee | $10,000 | $15,000 |
| Total Investment | $110,000 | $115,000 |
| Attributed Gross Profit | $180,000 | $230,000 |
| Net Contribution Before Other Costs | $70,000 | $115,000 |
Agency B costs an additional $5,000 but produces $50,000 more attributed gross profit in this illustrative example. Choosing Agency A solely because its management fee is lower would therefore destroy economic value.
Current PPC pricing guidance similarly recommends evaluating agency fees against revenue, qualified leads, wasted spend eliminated, and overall commercial outcomes rather than management price alone.
A More Complete Agency Cost Model
Sophisticated advertisers should expand breakeven analysis beyond management fees.
A more realistic comparison considers:
Total Paid Search Cost = Media Spend + Agency Fee + Creative Costs + Technology Costs + Landing Page Costs + Tracking Costs
| Cost Category | Percentage Model | Flat Retainer | Hybrid Model |
|---|---|---|---|
| Google Ads Spend | Variable | Variable | Variable |
| Management Fee | Variable | Fixed | Fixed + Variable |
| Setup Fee | Possible | Possible | Possible |
| Creative Production | Scope Dependent | Scope Dependent | Scope Dependent |
| Landing Pages | Often Additional | Scope Dependent | Scope Dependent |
| Tracking Infrastructure | Scope Dependent | Scope Dependent | Scope Dependent |
| Reporting Tools | May Be Included | May Be Included | May Be Included |
| Performance Bonus | No | Usually No | Possible |
This total-cost approach is especially important because current 2026 pricing research notes that management fees may exclude setup, creative, landing-page development, measurement infrastructure, and third-party technology.
Pricing Model Decision Matrix
| Advertiser Situation | Financially Relevant Model | Primary Reason |
|---|---|---|
| Very Small Ad Budget | Percentage with no high minimum | Low absolute management cost |
| Stable Mid-Sized Account | Flat Retainer | Predictable expenditure |
| Rapidly Scaling Account | Hybrid | Balances scalability and cost control |
| Large Media Budget | Tiered Percentage | Lower marginal management rate |
| High-Volume Enterprise | Negotiated Retainer or Hybrid | Prevents linear fee inflation |
| Strong Attribution Infrastructure | Performance Hybrid | Links compensation to outcomes |
| Highly Seasonal Business | Hybrid or Percentage | Fees can adapt to changing spend |
| Complex Multi-Market Account | Scope-Based Retainer | Complexity may matter more than spend |
The Critical Limitation of Breakeven Modeling
A mathematical crossover does not automatically determine which Google Ads agency pricing model delivers better value.
If a $3,500 retainer and a 12% agreement contain identical services, the $29,167 crossover calculation provides a useful financial decision point. If the retainer includes dedicated senior strategy, creative production, landing-page testing, advanced attribution, and CRM integration while the percentage agreement covers only campaign management, the comparison is no longer equivalent.
Advertisers should therefore perform two calculations: the nominal pricing breakeven and the performance-adjusted economic breakeven.
The first determines which agency costs less. The second determines which agency produces more profitable growth.
For Google Ads management in 2026, the second calculation is ultimately more important. A pricing model that saves $3,000 per month in management fees provides little economic benefit if weaker campaign execution simultaneously increases customer acquisition costs or sacrifices tens of thousands of dollars in incremental profit.
7. Hidden Fees, Ancillary Costs, and Contractual Fine Print
The Headline Google Ads Management Fee Is Not the Total Cost
A Google Ads agency proposal should be evaluated on its total cost of ownership rather than its advertised management fee alone. In 2026, published agency pricing research shows that setup, tracking, creative production, landing pages, reporting technology, call tracking, feed-management software, and other services may sit outside the headline retainer or percentage-of-spend fee.
A more useful financial framework is:
Total Monthly Agency Cost = Base Management Fee + Ancillary Service Charges + Technology Costs + Variable or Performance Fees
Google Ads media spend should then be added separately when calculating the advertiser’s complete paid-search investment.
| Cost Layer | Typical Expense | Why It Matters |
|---|---|---|
| Google Ads Media Spend | Variable | Purchases advertising inventory directly from Google |
| Core Management Fee | Retainer or percentage | Pays for ongoing campaign management |
| Setup and Onboarding | Often one-time | Covers initial audits, builds and configuration |
| Creative Production | Variable | Supports Search, Display, Demand Gen and Performance Max |
| Landing Pages | Project-based | Can materially influence conversion performance |
| Tracking and Analytics | Project or recurring | Supports reliable conversion measurement |
| Third-Party Technology | Recurring | Call tracking, feeds, reporting and other tools |
| Performance Fees | Variable | Applies under outcome-linked agreements |
Account Setup and Onboarding Fees
Setup fees are among the most common costs sitting outside ongoing Google Ads management.
Published 2026 pricing comparisons show examples ranging from a few hundred dollars to several thousand dollars. One recent comparison identified published setup charges ranging from $399 to several thousand dollars depending on provider and service tier, while another market analysis places onboarding broadly around $500 to $5,000.
| Setup Component | Typical Function | Pricing Impact |
|---|---|---|
| Historical Account Audit | Reviews previous performance and waste | One-time project cost |
| Campaign Architecture | Builds campaign and ad-group structures | Setup fee |
| Keyword Research | Establishes targeting framework | Setup fee or included |
| Conversion Tracking | Configures measurable actions | May be separately billed |
| Analytics Configuration | Connects measurement systems | May increase setup cost |
| Initial Creative | Produces launch advertisements | Included or additional |
| Strategy Development | Defines budgets and acquisition approach | Usually part of onboarding |
Advertisers should request an itemized onboarding scope. A higher setup charge can be justified when it includes substantial campaign rebuilding, analytics implementation and measurement work; it is harder to justify when it merely duplicates tasks already covered by the monthly management fee.
Creative Production Costs
Google Ads management and advertising production are not necessarily the same service.
Search ad copy may be included in many management agreements, while video, photography, sophisticated display assets, Performance Max creative, and larger creative packages are frequently treated separately. Current 2026 pricing research places basic external creative packages around several hundred dollars per month and more extensive production at $5,000 or more.
| Creative Requirement | Often Included? | Potential Additional Cost |
|---|---|---|
| Search Ad Copy | Frequently | Low |
| Responsive Search Ad Variations | Frequently | Low |
| Display Graphics | Depends on agency | Medium |
| Performance Max Assets | Depends on scope | Medium |
| Product Photography | Usually not | Medium to High |
| Video Production | Usually not | High |
| Continuous Creative Testing | Scope dependent | Recurring |
For creative-intensive campaigns, the contract should specify how many new concepts, images, videos, revisions and refresh cycles are included each month.
Landing Page Development
Landing-page costs can materially change the economics of a Google Ads engagement.
A management proposal may include campaign optimization without including the pages required to convert incoming traffic. Published 2026 estimates place separately billed agency landing-page work around $1,000 to $5,000 per page in some engagements.
| Landing Page Service | Potential Contract Treatment |
|---|---|
| Existing Page Recommendations | Often included |
| Conversion Audit | Included or separately scoped |
| Copywriting | May be additional |
| UX Design | Frequently additional |
| Development | Frequently additional |
| A/B Testing | Depends on management scope |
| Continuous CRO | Often separate service |
An apparently inexpensive Google Ads agency can therefore become considerably more expensive if every landing-page improvement requires an additional project.
Reporting, Analytics and Technology Charges
Third-party technology represents another frequently overlooked expense.
Agencies may use call-tracking systems, product-feed tools, reporting platforms, click-fraud systems, attribution software or other specialist applications. Some agencies absorb these costs into their management fee, while others pass them directly to clients. Published pricing guidance specifically identifies reporting, call tracking, feed-management and bid-management tools as potential additional charges.
| Technology Category | Possible Billing Structure | Contract Question |
|---|---|---|
| Reporting Dashboard | Included or recurring fee | Is standard reporting included? |
| Call Tracking | Monthly subscription | Who owns the numbers and data? |
| Feed Management | Monthly subscription | Is the license passed through at cost? |
| Attribution Software | Monthly subscription | Is it essential to campaign management? |
| Click-Fraud Software | Monthly subscription | Is it optional or mandatory? |
| CRM Integration | Setup plus maintenance | Who maintains the connection? |
| Server-Side Tracking | Project or retainer | Is ongoing maintenance included? |
Rather than automatically demanding that every software license be absorbed by the agency, advertisers should require full disclosure. Legitimate specialist software can create measurable value; undisclosed technology charges are the greater problem.
Minimum Monthly Management Fees
Percentage-of-spend proposals can also contain minimum monthly fee floors.
For example, an agency could advertise a 15% management rate subject to a $1,500 monthly minimum.
| Monthly Ad Spend | 15% Calculation | Minimum Fee | Actual Fee | Effective Rate |
|---|---|---|---|---|
| $3,000 | $450 | $1,500 | $1,500 | 50.0% |
| $5,000 | $750 | $1,500 | $1,500 | 30.0% |
| $7,500 | $1,125 | $1,500 | $1,500 | 20.0% |
| $10,000 | $1,500 | $1,500 | $1,500 | 15.0% |
| $20,000 | $3,000 | $1,500 | $3,000 | 15.0% |
This is why advertisers should model management costs against both normal and low-spend months, particularly when campaigns are seasonal. Current pricing research specifically identifies undisclosed or overlooked minimum fees as a source of unexpectedly high effective management rates.
Multi-Platform Pricing
Advertisers running Google Ads alongside Meta, Microsoft Advertising, LinkedIn or other channels should establish whether the quoted management fee applies to the entire media portfolio or Google Ads alone.
| Multi-Platform Pricing Method | Cost Behavior | Advertiser Consideration |
|---|---|---|
| Unified Retainer | One fee covers agreed platforms | Highly predictable |
| Separate Platform Retainers | Fee charged for each platform | Can become expensive as channels expand |
| Percentage of Total Media | One percentage across spend | Simple to calculate |
| Platform-Specific Percentages | Separate percentage per platform | Requires careful modeling |
| Hybrid Portfolio Fee | Base plus variable component | Flexible for larger programs |
There is no universal “100% markup per additional platform.” Pricing varies substantially between agencies. Advertisers should therefore ask for the combined portfolio cost rather than assuming that the Google Ads quotation automatically includes other advertising channels.
Contract Duration and Exit Costs
Headline pricing also fails to capture the financial effect of contract lock-ins.
Six- or twelve-month commitments can expose advertisers to substantial remaining fees if campaign performance deteriorates. Current PPC contract guidance recommends scrutinizing notice periods, automatic renewals, early-termination provisions and clauses that require payment of remaining contract value.
| Contract Provision | Potential Financial Risk | Preferred Protection |
|---|---|---|
| 6–12 Month Lock-In | Continued fees despite poor results | Performance-based exit provision |
| Long Notice Period | Additional months of fees | Reasonable written notice period |
| Automatic Renewal | Unexpected contract extension | Advance renewal notification |
| Early Termination Fee | High switching cost | Defined and limited termination terms |
| Remaining-Value Clause | Liability for future fees | Negotiate removal |
| Data Transfer Fee | Cost to recover business data | Contractual data portability |
| Account Transfer Restriction | Operational lock-in | Client ownership established upfront |
Account Ownership Is a Critical Contract Provision
Advertisers should maintain practical control over the Google Ads account, historical campaign data, conversion configurations and other business-critical assets.
Google’s own documentation confirms that Google Ads supports manager-account relationships and formal processes for transferring billing responsibility between paying managers.
A strong agency arrangement should therefore make account access and ownership explicit rather than leaving these matters to be resolved when the relationship ends.
| Asset | Recommended Advertiser Position |
|---|---|
| Google Ads Account | Advertiser retains administrative access |
| Campaign History | Remains accessible to advertiser |
| Conversion Actions | Remain with advertiser account |
| Audience Data | Remains available subject to platform rules |
| Merchant Center | Advertiser retains administrative control |
| Analytics Property | Advertiser-controlled |
| Tag Manager | Advertiser-controlled |
| CRM Data | Advertiser-controlled |
| Creative Assets | Ownership and licensing clearly defined |
| Reporting Data | Exportable at termination |
PPC contract guidance similarly recommends explicit contractual language establishing advertiser ownership and data portability rather than relying on informal assurances.
Direct Billing vs. Agency Billing
Billing structure deserves separate attention from account ownership.
Google supports formal changes to which payments profile or paying manager is responsible for advertising costs, including transfers associated with agency changes.
For many advertisers, direct platform billing offers maximum transparency because Google charges the advertiser while the agency invoices its management fee separately.
| Billing Arrangement | Transparency | Main Consideration |
|---|---|---|
| Client Pays Google Directly | Very High | Clean separation between media and management |
| Agency Consolidated Billing | Medium to High | Requires transparent reconciliation |
| Agency Resells Media | Variable | Verify original platform expenditure |
| Unitemized Combined Invoice | Low | Difficult to distinguish media from markup |
Agency-paid billing is not inherently improper. Larger agencies may legitimately provide consolidated invoicing or credit arrangements. The essential requirement is transparency regarding actual media expenditure, agency fees and any markup.
Media Markups and CPC Transparency
Advertisers should be particularly cautious when they cannot reconcile agency invoices against actual Google Ads expenditure.
If Google charges $20,000 in media but an intermediary invoices $22,000 without clearly identifying the additional $2,000 as a service or financing charge, the advertiser cannot accurately calculate its true media cost.
| Billing Practice | Transparency Level | Risk |
|---|---|---|
| Direct Google Billing | High | Low |
| Disclosed Media Markup | Medium to High | Known additional expense |
| Consolidated Agency Billing | Medium | Requires reconciliation |
| Undisclosed Media Markup | Very Low | Inflated effective advertising cost |
| No Platform Cost Visibility | Very Low | Difficult financial verification |
Current agency-pricing guidance specifically identifies undisclosed ad-budget markups as a hidden-cost risk and recommends transparent billing arrangements.
Total Cost of Ownership Example
Consider an advertiser presented with a seemingly straightforward $3,000 monthly Google Ads management retainer.
| Expense | Monthly Equivalent |
|---|---|
| Base Management Retainer | $3,000 |
| Reporting Technology | $250 |
| Call Tracking | $100 |
| Creative Production | $1,000 |
| Landing Page Work | $750 |
| Other Technology | $200 |
| Effective Agency and Support Cost | $5,300 |
The advertised $3,000 management fee has become a $5,300 effective monthly operating cost before Google Ads media expenditure is included.
Annualized, that difference represents $27,600 in expenses beyond the headline retainer.
Google Ads Agency Contract Due-Diligence Matrix
| Area to Verify | Lower-Risk Structure | Warning Sign |
|---|---|---|
| Management Fee | Fully itemized | Ambiguous pricing |
| Setup | Deliverables clearly specified | Unexplained onboarding charge |
| Media Billing | Transparent and reconcilable | Actual platform cost unavailable |
| Account Access | Client has administrative access | Agency controls access |
| Creative | Monthly allowance documented | Every asset unexpectedly extra |
| Reporting | Core reporting included | Basic reporting separately charged |
| Technology | Tools disclosed before signing | Surprise software pass-throughs |
| Minimum Fee | Clearly stated | Hidden in fine print |
| Contract Length | Reasonable exit provisions | Long lock-in without protection |
| Termination | Clear notice procedure | Remaining contract value payable |
| Data Portability | Explicitly guaranteed | Data inaccessible after termination |
| Performance Metrics | Commercial KPIs defined | Reporting focused only on activity |
What Advertisers Should Calculate Before Signing
The correct comparison is not Agency A’s $2,500 retainer against Agency B’s $3,000 retainer. Each proposal should be converted into an all-in annual cost using the same assumptions.
| Cost Component | Agency A | Agency B | Agency C |
|---|---|---|---|
| Annual Management Fees | Calculate | Calculate | Calculate |
| Setup Fees | Add | Add | Add |
| Creative | Add | Add | Add |
| Landing Pages | Add | Add | Add |
| Reporting and Tools | Add | Add | Add |
| Performance Fees | Add | Add | Add |
| Media Markups | Add | Add | Add |
| Exit Costs | Assess | Assess | Assess |
| Total Annual Agency Cost | Compare | Compare | Compare |
| Expected Business Outcome | Compare | Compare | Compare |
A transparent Google Ads agency agreement should allow an advertiser to calculate this figure before signing.
The strongest contracts clearly separate Google media spend from agency compensation, disclose setup and technology charges, define creative and landing-page responsibilities, establish account and data control, specify termination rights, and explain exactly how fees change when advertising budgets or campaign scope increase.
For advertisers evaluating Google Ads management pricing in 2026, contractual transparency is therefore just as important as the headline fee. A low advertised percentage or retainer can become expensive when ancillary charges accumulate, while a higher but genuinely all-inclusive proposal can ultimately provide lower total cost, easier forecasting and substantially lower switching risk.
8. Vertical Dynamics: E-Commerce vs. B2B Enterprise Paid Search
Why Industry Type Changes Google Ads Agency Pricing
Google Ads management costs cannot be evaluated purely according to monthly media spend. The advertiser’s business model determines the technical infrastructure, campaign architecture, optimization workload, measurement requirements, and specialist expertise required from an agency.
E-commerce Google Ads management is typically product- and transaction-centric. Agencies work extensively with Google Merchant Center, product feeds, Performance Max, Shopping campaigns, inventory data, promotional assets, and revenue-based bidding. B2B SaaS and enterprise lead generation, by comparison, depend more heavily on search-intent quality, CRM integration, qualified-lead measurement, offline conversion data, and long sales funnels.
These differences can materially affect the most appropriate Google Ads agency pricing model.
E-Commerce Google Ads Management Dynamics
For online retailers, Google Ads increasingly operates around structured product data and automated campaign systems rather than conventional keyword management alone.
Google’s current guidance confirms that Merchant Center product feeds serve as a foundation for retail Performance Max campaigns. Google recommends maintaining accurate product prices and availability, improving descriptions and imagery, supplying first-party audience signals, and continuously refreshing creative assets.
| E-Commerce Management Area | Operational Requirement | Agency Pricing Impact |
|---|---|---|
| Merchant Center | Product-data maintenance and diagnostics | Increases technical workload |
| Product Feed | Titles, attributes, categories and availability | Requires feed expertise |
| Performance Max | Asset groups, signals and optimization | Requires continuous monitoring |
| Standard Shopping | Product-level bidding and segmentation | Adds campaign-management scope |
| Creative Assets | Images, text and video | Can generate production costs |
| Inventory | Availability and seasonal changes | Requires frequent synchronization |
| Promotions | Sales and promotional campaigns | Creates seasonal workload |
| International Selling | Currency, language and market structures | Increases account complexity |
| Revenue Tracking | Transaction values and product data | Enables value-based optimization |
Product Feed Economics
The size of an e-commerce catalog is an important Google Ads agency pricing variable.
Managing a retailer with 50 relatively stable products is fundamentally different from managing an international retailer containing tens of thousands of SKUs, variants, changing prices, seasonal products, and inventory fluctuations.
| Catalog Profile | Relative Complexity | Typical Agency Requirement |
|---|---|---|
| Under 100 SKUs | Low | Basic feed management |
| 100 – 1,000 SKUs | Medium | Product segmentation and optimization |
| 1,000 – 10,000 SKUs | High | Advanced labels and feed rules |
| 10,000+ SKUs | Very High | Automated feed management and diagnostics |
| Multi-Country Catalog | Very High | Market-specific feeds and campaign architecture |
| Frequently Changing Inventory | Very High | Continuous synchronization and monitoring |
Google specifically recommends keeping product prices and availability current and monitoring Merchant Center product issues. This means feed quality is not simply an administrative task; it directly influences the products eligible to participate in advertising.
Performance Max and Retail Campaign Complexity
Performance Max has shifted significant portions of retail Google Ads management toward data quality, creative inputs, audience signals, product segmentation, measurement, and strategic oversight.
Google states that Performance Max uses its AI across bidding, targeting, creative, and attribution. For retailers, the product feed becomes a starting point for generating and serving advertisements, while additional text, image, and video assets are recommended to maximize eligible inventory.
| Traditional PPC Work | Modern E-Commerce PPC Work |
|---|---|
| Manual Keyword Bidding | Value-based bidding strategy |
| Individual Product Ads | Feed-driven advertising |
| Basic Search Campaigns | Performance Max and Shopping |
| Manual Bid Adjustments | AI bidding supervision |
| Keyword-Level Analysis | Product-level profitability analysis |
| Basic Conversion Tracking | Transaction and cart-value measurement |
| Static Ad Copy | Continuous creative asset refresh |
| Campaign Reporting | Product and revenue-level reporting |
Google also expanded product reporting in June 2026. Product-level metrics now cover additional Merchant Center-connected campaign environments, including Performance Max across networks as well as certain Video, App, and Demand Gen activity.
ROAS vs. Profitability for E-Commerce
E-commerce agencies are frequently evaluated against ROAS because transaction revenue can usually be connected directly to advertising.
However, ROAS alone does not indicate whether advertising is profitable.
Consider two hypothetical product categories:
| Metric | Product Category A | Product Category B |
|---|---|---|
| Google Ads Spend | $10,000 | $10,000 |
| Revenue | $40,000 | $40,000 |
| ROAS | 4.0x | 4.0x |
| Gross Margin | 60% | 25% |
| Gross Profit Before Ad Cost | $24,000 | $10,000 |
| Gross Profit After Ad Cost | $14,000 | $0 |
Both campaigns report identical 4.0x ROAS, yet their underlying economics are radically different.
For sophisticated e-commerce advertisers, agency performance discussions can therefore move beyond ROAS toward contribution margin, customer acquisition cost, new-customer profitability, customer lifetime value, and profit-on-ad-spend.
Why Hybrid Pricing Often Fits E-Commerce
E-commerce advertising budgets frequently fluctuate around holidays, product launches, promotions, and seasonal demand.
This makes hybrid and tiered percentage arrangements commercially useful because agency compensation can respond to substantial changes in account scale without increasing proportionately with every additional advertising dollar.
| E-Commerce Situation | Suitable Pricing Structure | Reason |
|---|---|---|
| Small Stable Store | Flat Retainer | Predictable workload |
| Growing DTC Brand | Hybrid | Balances base workload and growth |
| Large Retailer | Tiered Percentage | Lower marginal fee at scale |
| Highly Seasonal Retailer | Hybrid | Accommodates spending fluctuations |
| Complex International Retailer | Scope-Based Retainer + Variable Fee | Complexity extends beyond media spend |
| Large Catalog Retailer | Custom Hybrid | Feed workload requires specialist resources |
B2B SaaS and Enterprise Lead Generation Dynamics
B2B Google Ads management operates under different economic conditions.
A 2026 benchmark study covering more than 53 B2B SaaS Google Ads accounts reported an average Search CPC of $6.81, average conversion rate of 2.57%, and blended cost per lead of approximately $84. The study also cautions that lead definitions differ between accounts and that brand versus non-brand performance can vary significantly.
| 2026 B2B SaaS Google Ads Metric | Benchmark |
|---|---|
| Average CTR | 3.60% |
| Average CPC | $6.81 |
| Average Conversion Rate | 2.57% |
| Blended Average Cost Per Lead | $84 |
These figures provide a more current and directly B2B SaaS-specific benchmark than broad cross-industry CPC figures.
Why Cost Per Lead Can Be Misleading
A major B2B challenge is that a website conversion is not necessarily a commercially valuable lead.
An automated bidding system optimizing toward every form submission may favor inexpensive conversions even when those contacts rarely become qualified opportunities.
| Funnel Stage | Example Event | Commercial Value |
|---|---|---|
| Click | Website visit | Very Low |
| Lead | Form submission | Low to Medium |
| Marketing-Qualified Lead | Suitable prospect | Medium |
| Sales-Qualified Lead | Sales-ready opportunity | High |
| Opportunity | Active sales process | Very High |
| Closed Customer | Contract signed | Direct Revenue |
Consequently, sophisticated B2B agencies need to connect advertising optimization with downstream CRM outcomes rather than treating every front-end conversion equally.
CRM and Offline Conversion Infrastructure
Google’s own 2026 guidance increasingly reinforces this approach.
For lead-generation advertisers, Google recommends enhanced conversions for leads and specifically identifies “Qualified lead” or “Converted lead” as appropriate conversion goals. Advertisers can send first-party customer information and GCLIDs back into Google Ads so downstream events can be attributed to earlier advertising interactions.
| Measurement Layer | Basic PPC Account | Advanced B2B Account |
|---|---|---|
| Website Form | Tracked | Tracked |
| GCLID | Limited use | Captured and retained |
| First-Party Data | Limited | Integrated |
| CRM | Separate | Connected to advertising |
| Qualified Lead | Rarely imported | Imported |
| Converted Lead | Rarely imported | Imported |
| Conversion Value | Generic | Business-value based |
| Bidding Signal | Form submission | Qualified downstream outcome |
Google recommends continuing to provide GCLIDs whenever available and supports importing conversion values, customer identifiers, conversion timestamps, and other data associated with offline outcomes.
A Significant 2026 Measurement Change
B2B advertisers should also account for an important technical change introduced in 2026.
Beginning June 15, 2026, Google moved offline-conversion and enhanced-conversion-for-leads uploads toward the Data Manager API, with restrictions applying to legacy Google Ads API access. Google also recommends moving existing offline-conversion workflows toward enhanced conversions for leads.
This makes first-party data architecture, CRM connectivity, and conversion-data engineering increasingly relevant components of B2B Google Ads management rather than optional reporting enhancements.
Why B2B Agency Retainers Can Be Higher
A B2B account does not necessarily require a larger advertising budget to become technically complex.
An advertiser spending $30,000 per month could require extensive CRM integration, lifecycle mapping, conversion-value architecture, sales-team feedback, geographic segmentation, executive reporting, and attribution analysis.
| B2B Complexity Driver | Agency Resource Requirement |
|---|---|
| High CPC Keywords | Greater budget-control discipline |
| Narrow Buyer Audience | Detailed targeting and search-intent analysis |
| Long Sales Funnel | Downstream conversion measurement |
| CRM Integration | Technical implementation |
| Offline Conversions | Data synchronization |
| Lead Qualification | Sales and marketing alignment |
| Multiple Stakeholders | Advanced reporting |
| High Contract Value | Greater emphasis on lead quality |
| Low Conversion Volume | More difficult bidding optimization |
This can make a scope-based flat retainer or hybrid structure more rational than charging purely as a percentage of media spend.
E-Commerce vs. B2B Google Ads Management
| Dimension | E-Commerce | B2B SaaS / Enterprise |
|---|---|---|
| Primary Objective | Transactions | Qualified pipeline and customers |
| Core Campaign Types | Shopping, PMax, Search | Search, PMax, remarketing |
| Main Data Infrastructure | Merchant Center and transaction data | CRM and first-party lead data |
| Major Complexity Driver | Catalog and feed size | Sales funnel and attribution |
| Typical Conversion | Purchase | Lead or demo |
| True Business Outcome | Profitable sale | Qualified opportunity or customer |
| Important Efficiency Metric | ROAS / profit / CAC | CPL / CAC / pipeline value |
| Automation Risk | Spending toward low-margin products | Optimizing toward low-quality leads |
| Technical Agency Work | Feeds, product data, creative | CRM and conversion architecture |
| Scaling Challenge | Inventory and seasonal spending | Lead quality and sales attribution |
Vertical Pricing Impact Matrix
| Operational Factor | E-Commerce Pricing Impact | B2B Pricing Impact |
|---|---|---|
| Increasing Media Spend | High | Medium |
| Number of Products | Very High | Low |
| Product Feed Complexity | Very High | None |
| Merchant Center | Very High | Low |
| Creative Volume | High | Medium |
| CRM Integration | Medium | Very High |
| Offline Conversion Tracking | Medium | Very High |
| Lead Qualification | Low | Very High |
| Sales-Cycle Length | Low | Very High |
| International Expansion | High | High |
| Attribution Complexity | Medium to High | Very High |
How Pricing Models Differ by Vertical
The most appropriate Google Ads agency pricing structure should ultimately reflect what creates operational workload.
For e-commerce, media expenditure, product volume, Merchant Center complexity, creative requirements, and seasonal scaling can make tiered percentage or hybrid pricing attractive.
For B2B enterprise advertisers, advertising spend alone is often a poor representation of agency workload. A substantial portion of value may come from measurement architecture, CRM integration, conversion-quality analysis, attribution, and strategic search-intent management. Scope-based retainers or retainers combined with performance incentives can therefore provide a better commercial fit.
| Business Type | Potential Pricing Fit | Principal Pricing Driver |
|---|---|---|
| Small E-Commerce | Flat Retainer | Basic campaign and feed workload |
| Scaling E-Commerce | Hybrid | Spend plus catalog complexity |
| Enterprise Retail | Tiered / Hybrid | Scale, feeds and markets |
| Small B2B | Flat Retainer | Search and lead-generation scope |
| B2B SaaS | Scope-Based Retainer | CRM and lead-quality optimization |
| Enterprise B2B | Retainer + Performance Component | Attribution, pipeline and strategic complexity |
The Key Pricing Principle
E-commerce and B2B advertisers should not assume that two accounts spending the same amount on Google Ads should cost the same amount to manage.
A $50,000 monthly e-commerce account may require sophisticated feed engineering across thousands of products, continuous promotional updates, Performance Max creative, and profitability segmentation. A $50,000 B2B SaaS account may contain far fewer campaigns but require complex CRM integrations, qualified-lead imports, first-party data, offline conversion measurement, and sales-pipeline attribution.
The appropriate Google Ads agency fee therefore depends on operational complexity as much as advertising expenditure. In 2026, the strongest pricing structures increasingly reflect the actual systems an agency must manage: product and profit economics for e-commerce, and lead quality, CRM data, attribution, and customer acquisition economics for B2B.
9. Agency Retainers vs. In-House Google Ads Management: Economic Analysis
The Build-vs.-Buy Decision
Advertisers managing a meaningful Google Ads budget eventually face a fundamental decision: build paid-search expertise internally or retain an external Google Ads agency.
The comparison should extend beyond salary versus agency retainer. A realistic analysis includes compensation, employer costs, recruitment, software, management overhead, specialist coverage, continuity risk, and the amount of dedicated attention the advertising account actually receives.
Current 2026 pricing research places professional agency management broadly around 10%–20% of ad spend or approximately $500–$5,000+ per month, while a dedicated in-house Google Ads specialist can represent roughly $5,000–$9,000+ in monthly employment cost before considering the broader organizational implications.
Fully Loaded In-House Cost vs. Agency Retainer
A salary alone substantially understates the economic cost of an internal paid-search function. Employers may also carry payroll-related costs, benefits, recruitment, equipment, software, training, management time, and periods of reduced productivity during hiring or employee turnover.
| Financial and Operational Cost | In-House PPC Specialist | External Google Ads Agency |
|---|---|---|
| Core Compensation / Fee | Fixed annual salary | Monthly retainer or variable fee |
| Employer Costs | Additional | Included in agency economics |
| Recruitment | Employer responsibility | None |
| Training | Employer responsibility | Agency responsibility |
| PPC Software | Usually employer-funded | Frequently shared across agency clients |
| Equipment | Employer-funded | Agency-funded |
| Vacation Coverage | Requires internal backup | Usually covered by agency team |
| Specialist Support | Requires additional hires | Potentially available within agency |
| Employment Commitment | High | Contractual |
| Scalability | Requires hiring | Can often expand through scope adjustment |
Published 2026 comparisons estimate agency fees around $1,500–$3,000 monthly for accounts spending approximately $5,000–$15,000, compared with an illustrative mid-level in-house cost of approximately $9,800 per month in one current economic analysis.
Illustrative Fully Loaded Cost Comparison
The following model demonstrates how the economics can differ. These figures are planning assumptions rather than universal salary benchmarks.
| Annual Cost Component | In-House Specialist | Agency at $2,500 / Month |
|---|---|---|
| Base Compensation / Fee | $75,000 | $30,000 |
| Employer Benefits and Costs | $15,000 | Included |
| Software and Tools | $4,000 | Often Included |
| Equipment and Training | $3,000 | Included in Agency Overhead |
| Illustrative Annual Cost | $97,000 | $30,000 |
| Illustrative Monthly Cost | $8,083 | $2,500 |
Under these assumptions, the agency costs approximately $67,000 less annually.
However, the comparison does not establish that an agency is inherently superior. The internal employee provides substantially more dedicated organizational capacity than a typical $2,500 agency engagement.
Why Agencies Can Provide Broader Specialist Access
An important economic advantage of an agency is resource pooling.
A single internal PPC manager may need to understand campaign strategy, conversion tracking, Performance Max, Merchant Center, product feeds, analytics, reporting, creative testing, landing pages, attribution, and automation.
An agency can distribute those responsibilities across specialists.
| Required Capability | Single In-House Hire | Full-Service Agency |
|---|---|---|
| Paid Search Strategy | Core capability | Specialist |
| Campaign Execution | Core capability | Media buyer |
| Conversion Tracking | Depends on individual | Analytics specialist |
| Merchant Center | Depends on individual | E-commerce specialist |
| Feed Optimization | Depends on individual | Feed specialist |
| Creative | Usually requires support | Potential creative team |
| CRO | Usually requires support | Potential CRO specialist |
| Reporting | Employee responsibility | Account / analytics team |
| Senior Strategy | Depends on hire | Potential senior strategist |
This makes agency economics particularly attractive to smaller and mid-market advertisers that need several competencies but cannot justify building an entire paid-media department.
The Agency Does Not Provide a Full-Time Employee
The apparent cost advantage requires an important qualification.
Paying an agency $2,500 per month does not normally purchase 160 hours of dedicated specialist time. The agency earns its economics by distributing employee capacity across multiple clients.
Current 2026 agency-capacity guidance places mixed-service account-manager loads around 8–12 clients, while high-touch strategic relationships may be closer to 5–8. Standardized, lower-touch services can support substantially larger client portfolios.
| Service Model | Indicative Client Load | Expected Attention |
|---|---|---|
| High-Touch Strategic | 5–8 | High |
| Mixed Retainer Portfolio | 8–12 | Moderate to High |
| Standardized Service | 12–20 | Moderate |
| Highly Productized Service | 20+ | Lower individual touch |
Therefore, an agency costing one-third of an employee should not automatically be expected to provide the same quantity of dedicated labor.
Agency Account-Manager Capacity
Google Ads-specific agency research similarly suggests that approximately 10–12 accounts per manager is common, potentially increasing toward 15 for experienced managers handling smaller accounts. Other 2026 operational guidance places deep-attention capacity around 6–10 Google Ads accounts.
| Accounts per Specialist | Indicative Service Environment | Potential Risk |
|---|---|---|
| 3–5 | Large, complex accounts | Low capacity risk |
| 5–8 | High-touch management | Strong strategic availability |
| 8–12 | Normal mixed portfolio | Generally sustainable |
| 12–15 | Smaller or standardized accounts | Automation becomes increasingly important |
| 15–20+ | Highly systemized portfolio | Greater risk of reactive management |
The number alone should not determine agency quality. Five multinational enterprise accounts can require considerably more work than fifteen small local-search accounts.
When In-House Management Becomes Economically Attractive
The economics change as Google Ads investment and organizational complexity increase.
One current 2026 comparison estimates that, against a hypothetical $9,800 monthly internal cost and a 15% agency fee, the nominal fee breakeven occurs around $65,000 in monthly advertising expenditure.
At a $14,000 internal cost against a 10% agency fee, the crossover rises to approximately $140,000 in monthly media spend.
| Monthly Ad Spend | Agency Fee at 15% | $9,800 In-House Cost | Nominal Lower Cost |
|---|---|---|---|
| $10,000 | $1,500 | $9,800 | Agency |
| $25,000 | $3,750 | $9,800 | Agency |
| $50,000 | $7,500 | $9,800 | Agency |
| $65,333 | $9,800 | $9,800 | Approximate Breakeven |
| $75,000 | $11,250 | $9,800 | In-House |
| $100,000 | $15,000 | $9,800 | In-House |
| $250,000 | $37,500 | $9,800 | In-House |
This calculation is purely financial. At higher spending levels, an advertiser may require several internal specialists rather than one employee, which moves the true organizational breakeven considerably higher.
The Strategic Advantages of In-House Management
Cost is only one dimension of the decision.
An internal specialist spends the working week inside the organization and can develop considerably deeper knowledge of products, customers, margins, inventory, sales operations, competitive positioning, and internal decision-making.
| In-House Advantage | Strategic Impact |
|---|---|
| Dedicated Attention | One organization receives the employee’s focus |
| Brand Knowledge | Deep understanding develops over time |
| Internal Data Access | Easier connection with CRM and financial information |
| Faster Communication | Direct access to product and sales teams |
| Strategic Integration | PPC can align closely with broader company objectives |
| Institutional Knowledge | Learning remains inside the organization |
| Greater Control | Management directly determines priorities |
These benefits become increasingly valuable for large advertisers where paid search represents a strategically significant acquisition channel.
The Strategic Advantages of Agency Management
Agencies offer a different form of leverage.
Because they manage multiple advertisers, agencies can accumulate experience across industries, campaign structures, bidding strategies, measurement problems, and platform changes.
| Agency Advantage | Strategic Impact |
|---|---|
| Multiple Specialists | Wider technical skill coverage |
| Immediate Availability | Avoids lengthy recruitment |
| Cross-Account Experience | Exposure to more campaign situations |
| Tool Cost Sharing | Technology distributed across clients |
| Coverage | Reduced dependence on one employee |
| Scalability | Resources can expand without direct hiring |
| Platform Expertise | Teams continuously work inside advertising systems |
Internal Agency Delivery Economics
Advertisers can also evaluate whether an agency’s quoted fee appears operationally sustainable.
A useful agency-pricing rule of thumb is approximately 2.5–3 times fully loaded labor cost. A recent 2026 agency-finance analysis describes 2.5x as a practical floor and 3x as a useful pricing target. At 3x, revenue is conceptually divided into roughly one-third delivery labor, one-third overhead, and one-third operating contribution or profit.
A simplified model is:
Target Retainer = Estimated Delivery Hours × Fully Loaded Hourly Labor Cost × Pricing Multiplier
The $500 Retainer Problem
Consider an agency charging $500 per month while targeting a 3x labor-cost multiple.
Assume fully loaded delivery labor costs the agency $50 per hour.
$500 ÷ ($50 × 3) = 3.33 hours
The economic model therefore supports approximately 3.3 direct delivery hours per month.
| Monthly Retainer | Labor Cost per Hour | 3x Pricing Model | Approximate Delivery Hours |
|---|---|---|---|
| $500 | $50 | 3x | 3.3 |
| $1,000 | $50 | 3x | 6.7 |
| $1,500 | $50 | 3x | 10.0 |
| $2,500 | $50 | 3x | 16.7 |
| $5,000 | $50 | 3x | 33.3 |
| $10,000 | $50 | 3x | 66.7 |
The model does not prove exactly how many hours an agency will provide. Automation, junior-senior staffing mixes, standardized workflows, and economies of scale can materially alter delivery economics.
It does, however, provide a useful due-diligence question: if a remarkably inexpensive agency promises extensive strategy, creative production, reporting, tracking, meetings, and continuous optimization, advertisers should determine how sufficient specialist capacity can realistically be allocated to the account.
The One-Third Rule Requires an Important Correction
The 3x framework should not be interpreted as meaning that one-third of every retainer automatically becomes net profit.
Agency-finance benchmarks distinguish gross margin from final operating profit. Current PPC agency guidance suggests sustainable agencies may target roughly 50%–60% gross margins after delivery labor, while overhead, sales, management, administration, software, and other expenses still need to be paid before final profit is determined.
| Revenue Allocation Concept | What It Represents |
|---|---|
| Delivery Labor | People performing client work |
| Overhead | Management, software, sales and administration |
| Remaining Contribution | Available for profit and other business requirements |
| Net Profit | What remains after all expenses |
Therefore, the 3x labor formula is better treated as a pricing heuristic than a literal accounting formula.
Account Load as an Agency Due-Diligence Metric
Advertisers should ask who will actually manage the Google Ads account and how many other accounts that person manages.
Recent agency-capacity research suggests 8–12 clients can be realistic for mixed retainers, while 5–8 is healthier for high-touch strategic accounts. Google Ads-specific commentary similarly identifies 6–10 accounts as a realistic range for deep senior attention.
| Due-Diligence Question | Why It Matters |
|---|---|
| Who is the primary strategist? | Identifies actual senior involvement |
| Who performs weekly optimization? | Reveals delivery responsibility |
| How many accounts does the manager handle? | Indicates capacity |
| How many accounts does the media buyer manage? | Measures execution workload |
| Is work performed by junior staff? | Clarifies staffing structure |
| How often is the account reviewed? | Measures human oversight |
| What is automated? | Separates automation from specialist work |
| Who handles tracking problems? | Identifies technical depth |
| Who provides vacation coverage? | Tests operational resilience |
Agency vs. In-House Decision Matrix
| Business Situation | Agency | In-House | Potential Best Fit |
|---|---|---|---|
| Small Google Ads Budget | Strong | Weak | Agency |
| $5,000–$20,000 Monthly Spend | Strong | Usually expensive | Agency |
| Rapidly Growing Company | Strong | Medium | Agency or Hybrid |
| Complex $50,000+ Account | Strong | Increasingly attractive | Case dependent |
| Very Large Media Budget | Medium | Strong | In-House or Hybrid |
| Need Multiple Specialists | Strong | Expensive | Agency |
| Need Deep Brand Knowledge | Medium | Strong | In-House |
| Need Immediate Capability | Strong | Weak | Agency |
| Strong Internal Marketing Department | Medium | Strong | In-House or Hybrid |
| Global Enterprise | Strong | Strong | Hybrid team |
The Hybrid In-House Plus Agency Model
For sufficiently large advertisers, the strongest economic model may not be choosing exclusively between an agency and an employee.
An internal paid-media lead can own strategy, budgets, business intelligence, and organizational coordination while an external specialist agency provides additional capabilities such as feed engineering, tracking, creative production, advanced audits, or international expansion.
| Function | Internal Team | Specialist Agency |
|---|---|---|
| Business Strategy | Primary | Advisory |
| Budget Ownership | Primary | Advisory |
| Brand Knowledge | Primary | Supporting |
| Daily PPC Execution | Shared | Shared |
| Specialist Tracking | Oversight | Technical execution |
| Feed Engineering | Oversight | Specialist |
| Creative Scaling | Direction | Production |
| Independent Audits | Input | Primary |
| Institutional Knowledge | Primary | Supporting |
This model combines internal ownership with external specialist depth while reducing dependence on either a single employee or a single agency.
Economic Conclusion
For smaller and mid-market advertisers, an agency can often provide Google Ads expertise at a materially lower fixed cost than building an equivalent internal capability. At larger spending levels, however, percentage-based agency fees can become sufficiently substantial that dedicated internal expertise becomes financially attractive.
The decision should not be based on a universal rule such as “in-house only makes sense above $30,000 in monthly spend.” Current cost data does not support such a rigid threshold. The crossover depends on agency pricing, employee compensation, account complexity, geographic labor costs, and how many specialists the advertiser would actually need.
Advertisers evaluating agencies should also examine delivery economics. Extremely low retainers can imply limited human attention unless automation, standardized processes, or lower-cost staffing genuinely support the economics. Conversely, a high retainer does not guarantee senior attention.
The strongest evaluation therefore compares total annual cost, specialist depth, account-manager workload, strategic attention, measurable performance, and organizational control. The cheapest delivery model is valuable only when it provides enough expertise and capacity to protect the considerably larger Google Ads media budget under management.
10. Strategic Decision Framework for Choosing a Google Ads Agency Pricing Model
Choosing the Right Pricing Structure
The optimal Google Ads agency pricing model depends on more than the advertiser’s monthly media budget. Account complexity, growth trajectory, conversion-tracking maturity, creative requirements, geographic coverage, internal marketing resources, and the agency’s actual scope of work should all influence the decision.
Current 2026 pricing research consistently places percentage-based Google Ads management around 10%–20% of media spend, while retainers commonly range from approximately $500–$5,000 for smaller and mid-market accounts and can reach $10,000–$25,000 or more for complex enterprise programs. Hybrid arrangements combining a fixed base fee with variable pricing are also increasingly relevant as budgets scale.
Google Ads Agency Pricing Decision Matrix
| Business Stage and Monthly Ad Spend | Recommended Pricing Structure | Indicative Management Cost | Primary Contract Priorities |
|---|---|---|---|
| Early-Stage / SMB: Under $5,000 | Flat retainer or percentage subject to a reasonable minimum | $500 – $2,000 / month | Account ownership, limited commitment, transparent scope |
| Growth SMB: $5,000 – $25,000 | Flat retainer, percentage or hybrid | $1,500 – $5,000 / month | Creative scope, tracking, reporting and scaling rules |
| Scaling Business: $25,000 – $100,000 | Tiered percentage, hybrid or negotiated retainer | $4,000 – $12,000 / month | Declining rates, attribution, scope limits and KPI definitions |
| Enterprise: $100,000+ | Negotiated retainer, declining percentage or hybrid | $10,000 – $25,000+ / month | Dedicated resources, SLAs, data ownership and advanced measurement |
These ranges are planning benchmarks rather than universal tariffs. Published 2026 pricing data shows significant variation between providers, particularly because campaign complexity can matter as much as advertising expenditure.
Early-Stage and Small Businesses
For businesses spending less than approximately $5,000 per month on Google Ads, cost control is generally the primary consideration.
A straightforward flat retainer can provide predictable expenses, while percentage pricing can be economical when the agency does not impose a high minimum fee. However, minimum management fees become particularly important at this level.
| Evaluation Factor | Recommended Approach |
|---|---|
| Pricing Model | Flat retainer or low percentage |
| Contract Length | Prefer flexible initial commitment |
| Campaign Scope | Keep tightly defined |
| Account Ownership | Advertiser-controlled |
| Billing | Media spend separated from management |
| Reporting | Core reporting included |
| Setup Fee | Evaluate against actual implementation work |
| Primary KPI | Qualified conversions or profitable sales |
Current pricing evidence suggests that small accounts commonly encounter management fees of approximately $500–$2,000 per month, with minimum fees frequently overriding percentage calculations.
A rigid rule that every small advertiser should choose a flat retainer would therefore be inappropriate. A $5,000 advertiser offered legitimate 10% management with no minimum would pay only $500, potentially making percentage pricing substantially cheaper.
Mid-Market Growth Advertisers
Between approximately $5,000 and $25,000 in monthly Google Ads expenditure, advertisers have considerably more pricing flexibility.
Percentage management, flat retainers, and hybrid structures can all be economically viable. Published 2026 benchmarks place management fees for this segment broadly around $1,500–$5,000 per month.
| Mid-Market Requirement | Contract Recommendation |
|---|---|
| Increasing Ad Spend | Predetermine how management fees scale |
| Performance Max | Define creative and asset responsibilities |
| E-Commerce | Specify feed and Merchant Center responsibilities |
| Lead Generation | Define conversion-tracking scope |
| Landing Pages | Establish whether CRO is included |
| Reporting | Require business-level KPIs |
| Setup | Negotiate according to actual implementation workload |
| Scaling | Consider percentage caps or declining tiers |
At this stage, advertisers should begin negotiating the economics of future growth before that growth occurs.
If a company expects advertising expenditure to rise from $10,000 to $30,000 within a year, a fixed 15% fee would increase from $1,500 to $4,500 per month. A negotiated hybrid or declining percentage structure could materially reduce that increase.
Scaling Advertisers
For accounts spending approximately $25,000–$100,000 per month, linear percentage pricing deserves closer scrutiny.
A 15% management agreement produces a $7,500 fee at $50,000 in monthly media expenditure and $15,000 at $100,000. The agency’s workload does not necessarily double simply because media expenditure doubles.
This is where declining percentage tiers, capped management fees, scope-based retainers, and hybrid arrangements become particularly useful.
| Pricing Mechanism | Strategic Purpose |
|---|---|
| Declining Percentage | Reduces marginal management cost |
| Fee Cap | Prevents uncontrolled management-cost growth |
| Base + Percentage | Protects agency baseline while controlling scaling costs |
| Base + KPI Bonus | Connects additional compensation with performance |
| Scope-Based Retainer | Prices operational complexity rather than media volume |
Current 2026 pricing evidence confirms that percentage rates generally decline as spend increases and that larger advertisers can negotiate rates below standard 10%–20% headline levels.
Enterprise and High-Volume Advertisers
Advertisers spending more than $100,000 per month should generally negotiate rather than accept an off-the-shelf pricing structure.
Published 2026 pricing examples show enterprise management costs reaching approximately $10,000–$25,000 or more per month, while some agencies publishing high-volume pricing use declining rates around 6%–8%.
| Enterprise Requirement | Recommended Commercial Protection |
|---|---|
| Large Media Budget | Declining percentage or negotiated retainer |
| Multiple Countries | Market-specific scope definition |
| Dedicated Strategist | Named staffing allocation |
| Large Product Catalog | Feed-management responsibilities |
| CRM Attribution | Explicit technical scope |
| Offline Conversions | Defined measurement ownership |
| Creative Production | Monthly output commitments |
| Reporting | Executive-level reporting requirements |
| Response Time | Formal SLA |
| Data | Advertiser ownership and portability |
| Exit | Defined transition process |
A universal 5%–8% enterprise benchmark should not be treated as guaranteed market pricing. Published examples demonstrate that such rates are achievable in some high-spend arrangements, but enterprise fees remain highly dependent on complexity and scope.
Pricing Strategy by Attribution Maturity
Advertising budget is only one dimension of the decision. Measurement maturity should also influence how the agency is compensated.
| Attribution Maturity | Recommended Pricing Approach | Reason |
|---|---|---|
| Basic Conversion Tracking | Flat or Percentage | Performance incentives may be unreliable |
| Reliable Revenue Tracking | Flat, Percentage or Hybrid | Stronger commercial measurement |
| CRM-Integrated Leads | Hybrid | Qualified pipeline can support KPI incentives |
| Offline Conversion Integration | Hybrid / Performance Component | Downstream outcomes become measurable |
| Mature Revenue Attribution | Retainer + Performance Incentive | Stronger outcome alignment |
| Unreliable Tracking | Avoid Performance Pricing | Compensation cannot be objectively verified |
Performance-based compensation becomes more defensible as measurement quality improves. Advertisers should not attach significant agency compensation to revenue, qualified leads, or pipeline metrics that cannot be independently reconciled.
Pricing Strategy by Growth Trajectory
| Growth Pattern | Preferred Pricing Architecture |
|---|---|
| Stable Budget | Flat Retainer |
| Slowly Increasing Budget | Flat or Tiered Percentage |
| Rapid Scaling | Hybrid or Declining Percentage |
| Highly Seasonal | Hybrid |
| Unpredictable Spend | Percentage with Cap |
| Large Stable Enterprise Budget | Negotiated Retainer |
| Performance-Led Scaling | Base + KPI Incentive |
A rapidly scaling advertiser should pay particular attention to future pricing. A commercially attractive percentage agreement at $10,000 in monthly spend can become disproportionately expensive after the account reaches $100,000.
Mandatory Contract Protections
Regardless of pricing model, several protections should form part of the commercial evaluation.
| Contract Provision | Recommended Position | Risk Addressed |
|---|---|---|
| Google Ads Account Ownership | Advertiser owns account | Agency lock-in |
| Administrative Access | Advertiser retains access | Loss of control |
| Data Portability | Explicitly guaranteed | Historical data loss |
| Management Fee Calculation | Written formula | Billing ambiguity |
| Minimum Fee | Explicitly disclosed | Unexpected effective rates |
| Spend Tiers | Clearly documented | Scaling surprises |
| Included Services | Detailed scope | Scope disputes |
| Creative Allowance | Quantified | Unexpected production costs |
| Technology Fees | Disclosed | Hidden charges |
| Termination | Reasonable notice | Excessive switching costs |
| Auto-Renewal | Clearly disclosed | Unwanted renewal |
| Performance Bonus | Objective calculation | KPI disputes |
| Transition Assistance | Defined | Difficult agency handover |
PPC contract guidance strongly recommends advertiser ownership of advertising accounts and data, explicit portability rights, reasonable termination provisions, and avoidance of agreements that condition access to the advertiser’s own account on remaining with the agency.
Google Ads Agency Pricing Risk Matrix
| Pricing Model | Cost Predictability | Scaling Efficiency | Incentive Alignment | Contract Complexity | Best-Fit Environment |
|---|---|---|---|---|---|
| Flat Retainer | Very High | High if scope remains stable | High | Low | Stable accounts |
| Percentage of Spend | Medium | Medium | Medium | Low | Growing accounts with proportional complexity |
| Tiered Percentage | Medium to High | High | Medium to High | Medium | Large advertisers |
| Hybrid | High | High | High | Medium | Scaling businesses |
| Performance-Based | Medium | High | Potentially Very High | Very High | Mature attribution environments |
| Hourly | Low | Low | Medium | Low | Consulting and troubleshooting |
| Project-Based | Very High | Low | Medium | Low | Audits and implementations |
Red Flags When Comparing Agency Proposals
Advertisers should investigate unusually cheap offers as carefully as unusually expensive ones.
| Warning Sign | Potential Problem |
|---|---|
| Extremely Low Retainer | Insufficient specialist attention |
| High Percentage With No Declining Tiers | Expensive scaling |
| Unclear Minimum Fee | Unexpected monthly costs |
| Agency Owns Google Ads Account | Vendor lock-in |
| No Data Portability | Difficult transition |
| Long Contract Without Exit Mechanism | High switching cost |
| Undefined Performance Bonus | Billing disputes |
| Reporting Focused Only on Clicks | Weak commercial accountability |
| Every Creative Asset Costs Extra | Hidden total cost |
| No Named Account Manager | Unclear delivery responsibility |
| Large Account Portfolio per Manager | Limited strategic attention |
Published agency-operating commentary indicates account managers may commonly handle roughly 10–12 accounts, sometimes around 15 when accounts are smaller and standardized. This makes staffing workload a useful due-diligence question, but not a universal contractual limit: account complexity matters more than a fixed 12:1 ratio.
A Practical Google Ads Agency Selection Scorecard
Price should ultimately be one component of a broader evaluation.
| Evaluation Category | Suggested Weight |
|---|---|
| Proven Performance and Relevant Experience | 20% |
| Measurement and Attribution Capability | 15% |
| Strategic Quality | 15% |
| Pricing and Total Cost | 15% |
| Account Team and Seniority | 10% |
| Scope and Deliverables | 10% |
| Contract Flexibility | 5% |
| Account and Data Ownership | 5% |
| Reporting Quality | 5% |
| Total | 100% |
This prevents a procurement decision from becoming a simple contest for the lowest monthly management fee.
Recommended Pricing Model by Advertiser Profile
| Advertiser Profile | Recommended Starting Point |
|---|---|
| Under $5,000 Spend | Low-cost retainer or percentage with sensible minimum |
| $5,000–$25,000 Spend | Flat, percentage or simple hybrid |
| $25,000–$100,000 Spend | Hybrid or declining percentage |
| $100,000+ Spend | Negotiated retainer, hybrid or declining enterprise rate |
| Highly Seasonal Business | Hybrid |
| E-Commerce With Large Catalog | Hybrid / tiered structure |
| B2B With Complex CRM | Scope-based retainer |
| Mature Performance Advertiser | Base + KPI incentive |
| International Enterprise | Custom scope-based commercial agreement |
Final Recommendation
There is no universally cheapest or best Google Ads agency pricing model in 2026. The appropriate structure changes as the advertiser grows.
Smaller advertisers should prioritize manageable minimum fees, transparent scope, and contractual flexibility. Mid-market companies should establish how fees will change before aggressively increasing media budgets. Scaling advertisers should model percentage fees against flat and hybrid alternatives, while enterprise buyers should negotiate declining marginal rates, staffing commitments, advanced measurement requirements, and customized service levels.
The central financial principle is straightforward: agency compensation should not scale faster than the economic value created by the campaigns.
Advertisers should therefore compare proposals using total annual management cost, not merely headline monthly fees. They should calculate future costs at several media-spend levels, incorporate setup and ancillary expenses, determine the breakeven point between competing pricing models, and evaluate the result against CAC, qualified pipeline, contribution margin, and profitable incremental revenue.
Contract structure is equally important. Advertisers should retain control of their Google Ads accounts and data, understand every fee before signing, establish reasonable termination and transition provisions, and define exactly what the agency is expected to deliver.
The strongest Google Ads agency pricing arrangement is ultimately not the one with the lowest management fee. It is the structure that gives the advertiser sufficient expertise, measurement quality, strategic attention, scalability, and commercial accountability at a cost that remains sustainable as advertising investment grows.
Conclusion
Choosing the right Google Ads agency pricing model is ultimately about finding the best balance between cost, expertise, scalability, transparency, and measurable business performance. There is no single pricing structure that works for every advertiser. Flat monthly retainers, percentage-of-ad-spend fees, hybrid arrangements, performance-based compensation, hourly consulting, and project-based pricing each offer different advantages depending on campaign size and complexity.
For smaller advertisers, a modest flat retainer or percentage-based agreement can provide professional Google Ads management without the financial commitment of building an in-house paid media team. As monthly advertising spend increases, however, percentage-based management fees can become increasingly expensive. Growing businesses should therefore consider declining percentage tiers, fee caps, hybrid structures, or negotiated retainers that prevent agency costs from increasing disproportionately with media spend.
Large e-commerce, B2B SaaS, and enterprise advertisers require an even more nuanced approach. E-commerce businesses may need extensive Merchant Center management, product feed optimization, Performance Max expertise, creative production, and profitability analysis. B2B organizations may require CRM integration, offline conversion tracking, qualified-lead measurement, and sophisticated attribution. In these environments, campaign complexity can be a more meaningful pricing driver than advertising spend alone.
Advertisers should also look beyond the headline Google Ads management fee. Setup charges, creative production, landing-page development, reporting platforms, tracking infrastructure, software subscriptions, minimum monthly fees, performance bonuses, and contractual commitments can significantly increase the true cost of an agency relationship. Comparing agencies on total annual cost provides a much clearer financial picture than comparing advertised retainers or management percentages.
Contract structure is equally important. Businesses should maintain appropriate control and access to their Google Ads account, Merchant Center, analytics properties, conversion data, and other critical marketing assets. Management-fee calculations, included deliverables, spending thresholds, performance incentives, termination provisions, and additional charges should be clearly documented before an engagement begins.
Most importantly, the cheapest Google Ads agency is not necessarily the most cost-effective partner. Saving several thousand dollars in management fees provides little value if weaker campaign execution results in higher customer acquisition costs, poor-quality leads, wasted advertising spend, or lost revenue opportunities.
The strongest approach to Google Ads agency pricing is therefore to evaluate management costs alongside business outcomes. Advertisers should calculate pricing breakeven points, model fees at different future spending levels, examine the agency’s scope and resources, and measure performance against commercially meaningful metrics such as CAC, qualified pipeline, contribution margin, incremental revenue, and profitable ROAS.
As Google Ads becomes increasingly automated and data-driven, agency value is also shifting away from manual campaign activity toward strategy, measurement, creative experimentation, first-party data, conversion optimization, and profitable budget allocation. A well-designed Google Ads agency pricing model should reflect that evolution, creating a sustainable commercial relationship in which both advertiser and agency benefit from efficient, profitable, and scalable growth.
If you are looking for a top-class digital marketer, then book a free consultation slot here.
If you find this article useful, why not share it with your friends and business partners, and also leave a nice comment below?
We, at the AppLabx Research Team, strive to bring the latest and most meaningful data, guides, and statistics to your doorstep.
To get access to top-quality guides, click over to the AppLabx Blog.
People also ask
What are the most common Google Ads agency pricing models?
The most common models are flat monthly retainers, percentage-of-ad-spend fees, hybrid pricing, performance-based fees, hourly consulting, and fixed project pricing.
How much does a Google Ads agency cost?
Google Ads agency costs vary by ad spend, campaign complexity, services, and expertise. Many agencies charge a monthly retainer, a percentage of ad spend, or a combination of both.
What percentage of ad spend do Google Ads agencies charge?
Many Google Ads agencies charge around 10% to 20% of monthly ad spend. Rates may be higher for smaller accounts, while large advertisers can often negotiate declining or tiered percentages.
What is a flat monthly retainer for Google Ads management?
A flat retainer is a fixed monthly fee for managing Google Ads campaigns. It provides predictable costs and usually covers an agreed scope of strategy, optimization, reporting, and account management.
Is a flat retainer better than percentage-of-spend pricing?
It depends on campaign size and complexity. Flat retainers provide predictable costs, while percentage pricing scales with ad spend. Larger advertisers may save money with a negotiated flat retainer.
What is hybrid Google Ads agency pricing?
Hybrid pricing combines two models, such as a base monthly retainer plus a percentage of ad spend or performance bonus. It can balance predictable agency compensation with campaign growth.
What is performance-based Google Ads pricing?
Performance-based pricing links agency fees to agreed outcomes such as qualified leads, sales, revenue, CPA, or ROAS. Accurate conversion tracking and clearly defined performance criteria are essential.
Do Google Ads agencies charge setup fees?
Some agencies charge separate setup or onboarding fees for account audits, campaign creation, conversion tracking, keyword research, integrations, and initial strategy development.
Are Google Ads agency fees separate from advertising spend?
Yes, in most arrangements. Advertising spend is the money paid for media, while the agency management fee covers strategy, campaign management, optimization, reporting, and related services.
How does percentage-of-ad-spend pricing work?
The agency charges a percentage of monthly Google Ads spend. For example, a 15% management fee on $20,000 in monthly ad spend would equal a $3,000 agency management fee.
Do Google Ads agencies have minimum monthly fees?
Many agencies set minimum monthly management fees, especially for percentage-based pricing. This ensures the account generates enough revenue to cover strategy, optimization, reporting, and support.
What is tiered Google Ads management pricing?
Tiered pricing applies different management rates as ad spend increases. Higher spending levels may receive lower percentage rates, helping agency fees scale more efficiently with larger budgets.
What is a Google Ads agency minimum spend requirement?
A minimum spend requirement is the lowest monthly advertising budget an agency will manage. Agencies may use it to ensure campaigns have sufficient budget and commercial value for their service model.
How much should a small business pay for Google Ads management?
Small-business pricing depends on spend and scope. Businesses should compare the management fee with expected leads, sales, margins, and campaign complexity rather than selecting an agency solely by price.
How much do Google Ads agencies charge for large accounts?
Large accounts often use negotiated retainers, tiered percentages, declining ad-spend fees, or hybrid models. Pricing depends heavily on markets, campaigns, products, reporting, and measurement requirements.
What is hourly Google Ads management pricing?
Hourly pricing charges businesses for the actual time a PPC specialist spends on consulting, auditing, troubleshooting, optimization, or training. It is often suitable for limited or specialized work.
What is project-based Google Ads pricing?
Project-based pricing sets a fixed fee for a defined deliverable, such as an account audit, campaign setup, tracking implementation, migration, restructuring, or Google Ads strategy project.
Which Google Ads pricing model is best for small businesses?
Flat retainers or percentage-based models with reasonable minimum fees can suit small businesses. The best choice depends on budget, campaign complexity, required services, and expected growth.
Which Google Ads agency pricing model is best for e-commerce?
E-commerce businesses often benefit from hybrid, tiered, or retainer models because campaigns may require Shopping ads, Performance Max, product feeds, creative testing, tracking, and frequent optimization.
Which Google Ads pricing model is best for B2B companies?
B2B advertisers often benefit from retainers or hybrid pricing because successful campaigns can require CRM integration, offline conversion tracking, lead qualification, attribution, and long sales-cycle analysis.
What hidden costs should I check in Google Ads agency pricing?
Check for setup fees, creative production, landing pages, reporting tools, call tracking, feed management, attribution software, additional platforms, technology charges, and early termination fees.
How can I compare Google Ads agency pricing fairly?
Compare total annual costs, included services, campaign scope, account ownership, contract terms, team expertise, reporting, tracking capabilities, and expected business outcomes rather than monthly fees alone.
What is the breakeven point between flat and percentage pricing?
Divide the flat monthly retainer by the percentage fee. For example, a $3,500 retainer compared with a 12% management fee reaches breakeven at roughly $29,167 in monthly ad spend.
Does a higher Google Ads agency fee mean better performance?
Not necessarily. Higher fees may reflect deeper expertise or broader services, but price alone does not guarantee results. Evaluate relevant experience, strategy, measurement, transparency, and demonstrated performance.
Should Google Ads agency fees be based on ROAS?
ROAS can be useful, especially for e-commerce, but it should not be the only metric. Profit margins, customer acquisition cost, contribution margin, lead quality, lifetime value, and incremental revenue also matter.
Are performance-based Google Ads fees worth it?
They can work when outcomes and attribution are clearly measurable. Businesses should define qualified conversions, attribution rules, refunds, repeat customers, revenue recognition, and data sources before agreeing.
Who should own the Google Ads account when using an agency?
The advertiser should generally retain administrative access and practical control of its Google Ads account and associated business data. This makes changing agencies and preserving historical campaign data easier.
Can I negotiate Google Ads agency pricing?
Often, yes. Larger budgets, longer relationships, standardized scope, multiple campaigns, and predictable workloads may create opportunities to negotiate retainers, percentage rates, fee caps, or spending tiers.
How do I know if a Google Ads agency is too expensive?
Evaluate total management cost against campaign complexity and business outcomes. An agency can be expensive if fees consume too much margin without generating sufficient profitable leads, customers, or revenue.
How should I choose the right Google Ads agency pricing model?
Compare your ad budget, growth rate, campaign complexity, attribution maturity, required services, profitability, and expected outcomes. Choose a transparent model that can scale without agency fees growing faster than business value.
Sources
Ryze AI Agency Dashboard Dojo AI Prebo Digital SHOPLINE Evensen Marketing Catmo Media Smart Virtual Assistants Velocity PPC ADdictive Digital PPC.io 780 Marketing Iacoca Blue ZenoX Media Stratagem Systems Darkroom iMark Infotech VertoDigital Taskip Third Marble Marketing Improtics Jetfuel Agency NUP Solutions Windmill Strategy