


")


")


Key Takeaways
- Marketing budgets in 2026 are dominated by digital channels, with AI, programmatic advertising, and mobile video driving the majority of global ad spend.
- Retail media, first-party data strategies, and privacy-compliant marketing have become essential investments as third-party cookies disappear and consumer trust becomes a competitive advantage.
- AI-powered MarTech, influencer-driven social media, and data-led performance marketing are reshaping how brands allocate budgets to drive measurable growth.
The global marketing industry is undergoing one of the most profound transformations in its history. As businesses navigate an increasingly digital economy, marketing budgets are expanding in both scale and complexity. In 2026, global advertising expenditure has crossed the historic threshold of one trillion dollars, signaling a structural shift in how organizations prioritize brand visibility, customer acquisition, and long-term growth. However, the true story behind how marketers are spending in 2026 goes far beyond headline numbers. It reflects the convergence of artificial intelligence, data-driven strategies, retail commerce ecosystems, privacy regulations, and evolving consumer behavior.

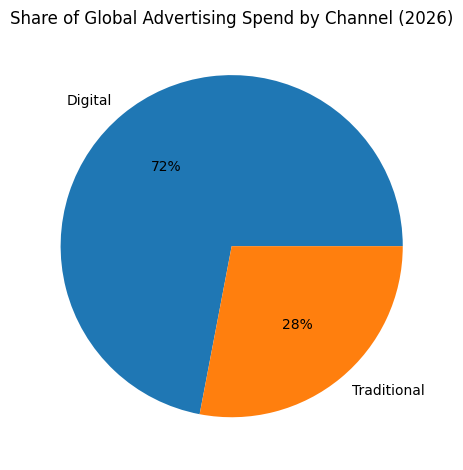
For decades, marketing spending followed relatively predictable patterns. Traditional media channels such as television, print, and radio dominated budgets, while digital marketing slowly emerged as a complementary channel. Today, that balance has been completely reversed. Digital platforms now command the majority of global marketing investments, fueled by advances in automation, programmatic advertising, social media ecosystems, and mobile-first consumer engagement. Brands are no longer just buying ad space; they are investing in entire marketing infrastructures designed to deliver measurable outcomes across every stage of the customer journey.

At the same time, marketers are operating in an environment defined by unprecedented technological change. Artificial intelligence has moved from experimental use cases into core marketing operations, helping organizations automate campaigns, personalize customer experiences, and analyze massive datasets in real time. Retail media networks have turned e-commerce platforms into high-margin advertising ecosystems, allowing brands to target consumers directly at the moment of purchase. Meanwhile, the decline of third-party cookies and the introduction of stricter data privacy regulations have forced companies to rethink how they collect and use customer data.
These forces are reshaping how marketing budgets are structured. Instead of allocating resources across a few traditional channels, companies are now distributing investment across a complex ecosystem that includes AI-powered marketing tools, programmatic advertising platforms, influencer collaborations, retail media networks, and first-party data infrastructure. The marketing budget of 2026 is no longer just a line item within corporate finance. It has become a strategic engine that drives revenue, customer relationships, and competitive advantage.

Another defining characteristic of the 2026 marketing landscape is the growing emphasis on measurable performance. Organizations are increasingly expected to demonstrate clear returns on their marketing investments. This has led to the widespread adoption of data analytics platforms, marketing automation systems, and sophisticated attribution models that track how every advertising dollar contributes to revenue generation. Performance marketing, once considered a specialized discipline, is now integrated into nearly every marketing campaign.
However, while automation and data analytics have dramatically improved efficiency, they have also created new challenges. Consumers today are exposed to an overwhelming volume of digital content, advertisements, and brand messages across countless platforms. Attention has become one of the most valuable and scarce resources in the modern economy. As a result, marketers must find ways to cut through the noise while maintaining authenticity and trust. This has driven a renewed focus on brand building, storytelling, and community engagement.

Trust has become particularly important in an era defined by growing privacy concerns. Consumers are increasingly aware of how their data is collected and used, and many are demanding greater transparency from the brands they interact with. This shift has pushed marketers toward first-party data strategies, where organizations build direct relationships with customers through owned platforms such as websites, mobile apps, loyalty programs, and email channels. In the post-cookie world, the brands that succeed are those that can create value-driven relationships with their audiences while respecting privacy and regulatory requirements.

The rise of social media platforms and the creator economy has also transformed marketing spending patterns. Platforms such as TikTok, Instagram, and YouTube have become central to how consumers discover products, interact with brands, and make purchasing decisions. Influencer marketing, once considered experimental, has matured into a multi-billion-dollar industry that enables brands to reach niche communities through trusted creators. At the same time, smaller creators with highly engaged audiences are becoming increasingly valuable partners for brands seeking authentic connections.
Another emerging dimension of the marketing ecosystem involves decentralized social platforms and Web3-based communities. Although still in the early stages of development, these technologies represent a potential shift in how creators and users control their online identities and relationships. In decentralized networks, audience ownership and content monetization may operate differently than on traditional social platforms, opening new possibilities for marketing and community engagement.
Marketing technology, commonly referred to as MarTech, is another critical factor shaping how marketers are spending in 2026. Modern marketing teams rely on sophisticated technology stacks that integrate customer data platforms, automation tools, analytics dashboards, and content management systems. These technologies enable organizations to coordinate campaigns across multiple channels while delivering personalized experiences at scale. However, the growing complexity of MarTech ecosystems has also introduced new financial considerations, as the true cost of operating these systems often extends far beyond software licensing.
As organizations continue investing heavily in marketing technologies and digital media, one question becomes increasingly important: how can companies allocate their marketing budgets effectively in such a complex environment? The answer requires balancing multiple priorities simultaneously. Marketers must invest in technology to remain competitive, allocate media budgets strategically across digital platforms, comply with evolving privacy regulations, and maintain authentic relationships with customers.
The marketing strategies that succeed in 2026 are those that integrate these elements into a cohesive framework. Leading organizations combine artificial intelligence with human creativity, data-driven decision-making with ethical data practices, and performance optimization with long-term brand building. Rather than focusing on individual channels, they design integrated marketing ecosystems that connect content, commerce, community, and customer intelligence.
Understanding how marketers are spending in 2026 therefore provides valuable insight into the future of business growth and digital innovation. Marketing has evolved into one of the most influential forces shaping the global economy. It determines how products are discovered, how brands build loyalty, and how companies compete in increasingly crowded digital markets.
This comprehensive guide explores the key trends defining marketing budgets in 2026. From artificial intelligence and retail media to influencer marketing, data privacy, and emerging digital platforms, it examines where companies are investing their marketing resources and why these investments matter. By understanding these patterns, business leaders, marketers, and entrepreneurs can better prepare for the next phase of digital marketing evolution and position themselves for success in an increasingly intelligent, data-driven, and interconnected marketplace.
But, before we venture further, we like to share who we are and what we do.
About AppLabx
From developing a solid marketing plan to creating compelling content, optimizing for search engines, leveraging social media, and utilizing paid advertising, AppLabx offers a comprehensive suite of digital marketing services designed to drive growth and profitability for your business.
At AppLabx, we understand that no two businesses are alike. That’s why we take a personalized approach to every project, working closely with our clients to understand their unique needs and goals, and developing customized strategies to help them achieve success.
If you need a digital consultation, then send in an inquiry here.
Or, send an email to [email protected] to get started.
How Marketers Are Spending in 2026
- The Trillion-Dollar Milestone and the Macro-Economic Structural Shift
- Regional Investment Divergence and Emerging Growth Corridors
- The Digital Hegemony: Programmatic and Mobile Primacy
- Retail Media: The High-Margin Frontier of Integrated Commerce
- The AI Supercycle: Reallocating Capital for Productivity and Revenue
- Social Media Platform Dynamics and the Creator Economy
- B2B and Sector-Specific Budgetary Benchmarks
- MarTech Stack Economics and the Total Cost of Ownership
- Data Privacy, Compliance, and the First-Party Mandate
- Decentralized Social and the Frontiers of Media
- The Unified Marketing Budget of 2026
1. The Trillion-Dollar Milestone and the Macro-Economic Structural Shift
The global advertising industry in 2026 has reached a historic point where total spending has surpassed the one-trillion-dollar mark for the first time in modern marketing history. This milestone reflects a structural transformation in the global economy rather than simply representing numerical growth in media budgets. Advertising has evolved into a core infrastructure for economic expansion, enabling brands to drive visibility, consumer demand, and competitive differentiation at scale.
Historically, advertising investment followed the trajectory of broader economic activity. However, by 2026 this pattern has shifted. Marketing expenditure is expanding faster than global GDP growth, demonstrating how companies increasingly view media as the primary gateway for consumer engagement and revenue generation.
The modern media ecosystem has therefore become the front door of brand interaction. Whether consumers encounter a brand through social feeds, search results, retail platforms, streaming video, or connected in-store environments, advertising now operates as the central mechanism through which businesses build awareness, influence purchasing behavior, and maintain cultural relevance.
Global Advertising Market Indicators
| Metric | 2025 Estimated Value | 2026 Forecast Range |
|---|---|---|
| Total Global Advertising Spend | $950 Billion – $1.16 Trillion | $1.04 Trillion – $1.30 Trillion |
| Global Advertising Growth Rate | 5.5% | 5.1% – 6.0% |
| Global GDP Growth | 3.2% | 3.1% |
| Digital Share of Total Advertising | 74.4% | 68.7% – 76.0% |
| Programmatic Share of Digital Advertising | 80%+ | Approximately 90% |
The data shows a widening gap between global economic growth and advertising investment. This gap highlights how marketing has become a strategic lever for driving demand in increasingly competitive and digitally fragmented markets.
The Structural Shift Toward Media-Led Growth
The advertising industry in 2026 is characterized by a major structural shift in how companies allocate resources. Media investment is no longer treated as a secondary function of marketing communications. Instead, it plays a foundational role in shaping brand visibility, consumer discovery, and purchase pathways.
As digital ecosystems continue to dominate consumer attention, organizations are prioritizing marketing strategies that combine brand storytelling with measurable performance outcomes. Media channels are increasingly integrated with commerce, data analytics, and artificial intelligence systems that enable highly personalized interactions.
This shift reflects a broader transformation in the global marketing landscape where brands operate within continuous digital feedback loops. Consumer behavior generates data, data informs algorithms, and algorithms guide media investment decisions.
Evolution of Marketing Strategy Models
| Marketing Framework | Traditional Media Era | Algorithmic Media Era |
|---|---|---|
| Strategic Objective | Brand awareness and reach | Business outcomes and revenue impact |
| Audience Targeting | Broad demographic segments | Behavioral and predictive audience modeling |
| Media Buying Process | Direct negotiations and manual planning | Automated programmatic bidding systems |
| Campaign Optimization | Periodic reporting cycles | Continuous real-time algorithmic optimization |
| Data Integration | Limited campaign analytics | Cross-channel consumer data ecosystems |
| Measurement Metrics | Impressions and reach | Conversions, customer lifetime value, and sales impact |
Within this new environment, advertising operates as an integrated system connecting content, commerce, community participation, and consumer data. Every interaction point—from a streaming platform advertisement to a retail search result—has the potential to influence purchasing behavior.
The Emergence of the Algorithmic Marketing Era
Industry analysts frequently describe the current phase of advertising evolution as the Algorithmic Era. This era is defined by the widespread integration of artificial intelligence, machine learning, and predictive analytics into the media planning and buying process.
Marketing budgets are increasingly optimized through automated systems capable of evaluating vast datasets in real time. These systems analyze user behavior, contextual signals, geographic patterns, and purchase intent to determine how advertising impressions should be allocated.
The result is a marketing ecosystem where campaigns evolve dynamically rather than being fixed in advance. Algorithms continuously test creative variations, audience segments, and bidding strategies to maximize campaign performance.
Algorithmic Media Capabilities in Modern Advertising
| Technology Layer | Function in Advertising Systems | Marketing Advantage |
|---|---|---|
| Artificial Intelligence | Predicts audience behavior and campaign outcomes | Higher targeting precision |
| Machine Learning | Continuously improves ad delivery performance | Automated campaign optimization |
| Real-Time Bidding | Enables automated auction-based media buying | Efficient budget allocation |
| Consumer Data Platforms | Unify cross-channel customer insights | Personalization at scale |
| Predictive Analytics | Forecasts purchase likelihood | Improved conversion rates |
These technologies collectively allow advertisers to move beyond traditional exposure metrics and focus on measurable outcomes such as transactions, customer acquisition, and lifetime value.
Impact of Global Events on Advertising Demand
The year 2026 is also notable because of a concentration of global events that drive elevated advertising activity. Major international sports tournaments, large-scale cultural gatherings, and important election cycles contribute to surges in audience engagement across broadcast and digital platforms.
These events create temporary spikes in advertising demand as brands compete to capture heightened consumer attention. Media inventory becomes more valuable during these periods, particularly across streaming video, social platforms, and connected television environments.
Event-Driven Advertising Boost Factors
| Event Category | Example Global Events | Advertising Impact |
|---|---|---|
| International Sports | Olympic Winter Games, FIFA World Cup | Large global audiences and brand visibility |
| National Elections | United States and major economic regions | Increased political advertising spending |
| Cultural Mega-Events | Global entertainment and music festivals | High engagement across social platforms |
| Retail Shopping Seasons | Global e-commerce sales events | Surge in retail media investments |
Such cycles amplify overall advertising expenditure and contribute to the industry’s mid-to-high single-digit growth rate during the year.
Channel Distribution Within the Global Advertising Ecosystem
Although the overall advertising market has surpassed the trillion-dollar threshold, spending is heavily concentrated in a limited number of high-growth digital channels. Search advertising, social media platforms, retail media networks, and streaming video environments capture the majority of global investment.
Distribution of Global Advertising Spend by Media Channel
| Media Channel | Estimated Market Share | Key Growth Drivers |
|---|---|---|
| Search Advertising | 25% – 30% | High consumer purchase intent |
| Social Media Advertising | 20% – 25% | Algorithmic content discovery |
| Retail Media Networks | 10% – 15% | Shopper data and point-of-purchase targeting |
| Online Video and Connected TV | 10% – 15% | Expansion of streaming platforms |
| Programmatic Display Advertising | 8% – 12% | Automated audience targeting |
| Traditional Broadcast and Print | 10% – 15% | Event-driven audience spikes |
Retail media represents one of the fastest-growing segments within this ecosystem. Major online marketplaces and large retailers have transformed their consumer data into powerful advertising platforms that allow brands to target shoppers directly within commerce environments.
Variations in Industry Forecasts
While the advertising industry widely agrees that global spending has exceeded one trillion dollars, leading research organizations present slightly different forecasts for the total market size. These differences arise primarily from methodological variations regarding which categories of advertising expenditure are included.
Some forecasts incorporate emerging formats such as retail media networks, influencer marketing ecosystems, and independent digital platforms that operate outside major advertising exchanges.
Comparative Global Advertising Forecasts for 2026
| Research Organization | 2026 Advertising Spend Estimate | Methodological Focus |
|---|---|---|
| Dentsu | Approximately $1.04 Trillion | Conservative estimate excluding some retail media sectors |
| GroupM | Approximately $1.22 Trillion | Expanded inclusion of digital media channels |
| WARC | Approximately $1.30 Trillion | Broader methodology including long-tail digital platforms |
Despite these differences, analysts broadly agree that the industry is entering a phase of sustained growth driven by digital platforms, automated advertising systems, and data-driven marketing strategies.
Strategic Implications for Marketers
The trillion-dollar milestone underscores a fundamental transformation in the role of advertising within the global economy. Marketing is no longer limited to brand messaging; it has evolved into an integrated system that combines technology, data science, media distribution, and commerce.
Organizations that succeed in this environment are those that treat media investment as a strategic growth engine rather than a supporting marketing activity.
Key Strategic Priorities for Brands in 2026
| Strategic Priority | Business Objective | Marketing Outcome |
|---|---|---|
| Data Infrastructure Investment | Strengthen consumer intelligence | Improved targeting accuracy |
| AI-Driven Media Optimization | Automate campaign performance | Higher return on advertising spend |
| Commerce Media Integration | Connect marketing with retail platforms | Increased conversion rates |
| Cross-Channel Measurement | Track performance across platforms | Better budget allocation decisions |
| Creative Personalization | Deliver tailored brand experiences | Stronger customer engagement |
As the advertising ecosystem continues to evolve, the convergence of media, technology, and consumer data will shape the next phase of global marketing growth. The trillion-dollar milestone represents not only the scale of modern advertising but also the increasing centrality of media investment in shaping the competitive landscape of the digital economy.
2. Regional Investment Divergence and Emerging Growth Corridors
Global marketing investment in 2026 reveals a highly uneven regional distribution, reflecting the varying pace of economic development, digital adoption, and consumer behavior across different markets. While global advertising spending has crossed the trillion-dollar threshold, this growth is not evenly shared. Instead, certain regions are experiencing rapid acceleration driven by mobile connectivity, digital commerce, and platform ecosystems, while others are moving forward at a more measured pace due to macroeconomic constraints.
Two major growth corridors dominate the global advertising landscape: the Asia-Pacific region and the Americas. These regions collectively account for the majority of new advertising investment. In contrast, Europe displays more modest growth patterns, influenced by slower economic recovery and structural shifts in key industrial sectors.
Global Regional Advertising Investment Outlook
| Region | Forecasted Advertising Spend (USD) | Growth Rate | Primary Growth Drivers |
|---|---|---|---|
| North America | $370.0 Billion | +8.5% | Midterm elections, FIFA World Cup, Connected TV |
| Asia Pacific | $290.0 Billion | +9.2% | India growth, China digital commerce, mobile video |
| Europe (EMEA) | $175.0 Billion | +5.1% | UK market resilience, gradual digital transition |
| Latin America | $35.0 Billion | +6.5% | Brazil retail media and social commerce expansion |
| Middle East & Africa | $14.0 Billion | +5.0% | Digital diversification and platform adoption |
These figures illustrate the increasingly globalized yet regionally distinct nature of advertising markets. The rise of digital infrastructure and e-commerce ecosystems has amplified growth in emerging economies, while mature markets continue to evolve through technological innovation and media format transformation.
Asia-Pacific: The Fastest-Growing Advertising Powerhouse
The Asia-Pacific region stands out as the most dynamic advertising market globally. Growth projections ranging from 5.4 percent to over 9 percent reflect a combination of expanding internet access, rising consumer purchasing power, and widespread mobile-first behavior across developing economies.
India and China are the primary engines of this expansion. Both countries represent enormous consumer bases that have rapidly integrated digital technologies into everyday life.
Key Drivers of Advertising Growth in Asia-Pacific
| Market | Estimated Advertising Spend | Growth Catalysts | Dominant Media Formats |
|---|---|---|---|
| China | Over $180 Billion | Integrated digital ecosystems and social commerce | Mobile platforms, e-commerce advertising |
| India | Rapidly expanding market | Smartphone adoption and middle-class growth | Mobile video, social media, digital payments |
| Southeast Asia | Emerging digital economies | Youth demographics and mobile internet access | Social media and mobile commerce |
China continues to dominate the regional landscape through highly integrated digital ecosystems that combine social networking, payment platforms, e-commerce, and entertainment into unified consumer experiences. Advertising investment is heavily concentrated in mobile environments where brands can interact with users throughout the entire purchase journey.
India, meanwhile, has emerged as one of the fastest-growing advertising markets in the world. Rapid smartphone adoption, lower mobile data costs, and a rapidly expanding middle class have dramatically increased the scale of the country’s digital advertising environment.
Americas: Stability and Event-Driven Spending
The Americas remain a major pillar of the global advertising economy. The region’s total market size is projected to reach approximately $460.5 billion in 2026, supported by a combination of digital platform dominance, strong consumer demand, and major international events that drive elevated media investment.
The United States continues to represent the largest advertising market globally by a substantial margin. Digital advertising alone in the country is expected to reach between $298 billion and $413 billion by the end of the year.
Advertising Market Performance in the Americas
| Market | Estimated Spend | Growth Rate | Strategic Drivers |
|---|---|---|---|
| United States | $298B – $413B (Digital) | Stable growth | Political advertising, sports events, streaming platforms |
| Brazil | Rapid expansion | 9.1% | Social commerce and retail media growth |
| Canada | Mature market | Moderate growth | Digital platform consolidation |
Two major events significantly influence advertising activity in the United States during 2026: the FIFA World Cup and national midterm elections. Together, these events are expected to inject approximately $21 billion into the American advertising market.
Political campaigns represent one of the largest drivers of television and digital advertising during election years. At the same time, international sports events attract global audiences across streaming platforms, social media networks, and traditional broadcast channels.
Brazil has emerged as the fastest-growing major advertising market in the world, with an annual growth rate exceeding nine percent. The country’s expansion is fueled by the rapid adoption of social commerce platforms and the rise of retail media networks operated by major online marketplaces and large retailers.
Europe: Fragmented Recovery and Selective Growth
Europe presents a more complex and uneven advertising landscape. While certain markets continue to demonstrate resilience and moderate growth, others remain constrained by economic uncertainty and slower industrial recovery.
The United Kingdom remains the strongest advertising market within the region, with projected growth of approximately 5.7 percent. The country’s digital advertising ecosystem remains highly developed, supported by advanced programmatic infrastructure and a mature online retail sector.
Germany, in contrast, is experiencing slower growth, with advertising investment projected to increase by only around 2.7 percent. The slower pace is largely linked to economic challenges within the manufacturing and automotive sectors, which traditionally represent major advertising contributors.
European Advertising Market Comparison
| Country | Growth Rate | Market Characteristics | Key Advertising Sectors |
|---|---|---|---|
| United Kingdom | 5.7% | Highly developed digital advertising ecosystem | Programmatic advertising, retail media |
| Germany | 2.7% | Slower economic recovery | Automotive and industrial advertising |
| France | Moderate growth | Balanced media mix | Luxury and retail sectors |
Despite these challenges, Southern European countries have shown remarkable growth in specific advertising niches, particularly in mobile app marketing and user acquisition campaigns.
Mobile User Acquisition Growth in Southern Europe
| Country | Growth in Mobile User Acquisition Spend | Primary Growth Drivers |
|---|---|---|
| Italy | 143% | Expansion of mobile gaming and app ecosystems |
| Spain | 157% | Growth in fintech and digital services apps |
This surge reflects the rapid expansion of mobile-first business models, particularly in sectors such as mobile gaming, financial technology applications, and subscription-based digital services.
Emerging Markets in Latin America and Africa
Beyond the major economic centers, several emerging markets are gradually increasing their presence within the global advertising economy. Latin America, led by Brazil, continues to demonstrate strong digital adoption trends, particularly in social media marketing and influencer-driven commerce.
Meanwhile, the Middle East and Africa region is experiencing steady growth as mobile connectivity expands and digital advertising platforms become more accessible to businesses across the region.
Advertising Growth Drivers in Emerging Regions
| Region | Key Markets | Growth Catalysts | Dominant Platforms |
|---|---|---|---|
| Latin America | Brazil, Mexico | Social commerce, mobile payments | Social media platforms |
| Middle East | UAE, Saudi Arabia | Digital transformation initiatives | Mobile advertising |
| Africa | Nigeria, South Africa | Smartphone adoption and youth demographics | Social media and messaging platforms |
These emerging regions represent important long-term opportunities for advertisers seeking to reach rapidly expanding consumer populations.
Strategic Implications for Global Marketers
The uneven distribution of advertising growth across regions has significant implications for multinational marketing strategies. Rather than relying on uniform global budget allocations, companies are increasingly adopting region-specific media strategies that reflect local economic conditions, platform usage patterns, and consumer behaviors.
Regional Advertising Investment Strategy Matrix
| Market Category | Investment Strategy | Media Priorities |
|---|---|---|
| High-Growth Digital Markets | Aggressive expansion | Mobile video, social commerce, retail media |
| Mature Digital Markets | Performance optimization | Programmatic advertising and connected TV |
| Emerging Economies | Infrastructure and brand building | Social media and mobile-first advertising |
| Slower Recovery Markets | Selective investment | Hybrid traditional and digital media |
The global advertising environment in 2026 therefore demands a highly localized approach to marketing investment. Successful brands are those that dynamically allocate budgets toward regions where digital adoption, consumer spending, and media engagement are accelerating most rapidly.
As emerging markets continue to digitize and established markets refine their media ecosystems, regional investment divergence will remain one of the defining characteristics of the global advertising industry.
3. The Digital Hegemony: Programmatic and Mobile Primacy
By 2026, digital advertising has evolved beyond being merely the fastest-growing marketing channel. It has become the structural foundation upon which the entire global advertising ecosystem is built. Digital platforms now capture the majority of global advertising budgets, fundamentally altering how marketers allocate resources, measure performance, and reach consumers.
Industry forecasts indicate that digital channels account for between 68.7 percent and 76 percent of total advertising expenditure worldwide. This means that more than two-thirds of every advertising dollar is directed toward digital environments such as search engines, social media platforms, streaming services, and online marketplaces.
Digital advertising investment alone is projected to exceed a range of approximately 570 billion to 786 billion dollars in 2026. This dramatic growth represents a substantial reallocation of marketing capital away from traditional formats such as print media, terrestrial television, and radio.
The dominance of digital channels is directly tied to changes in consumer behavior. On average, global audiences now spend roughly forty percent of their total media consumption time interacting with digital platforms. As audiences continue shifting toward mobile devices, social media ecosystems, and streaming entertainment services, advertisers are increasingly compelled to follow consumer attention into these environments.
Global Digital Advertising Market Overview
| Digital Advertising Metric | 2026 Estimated Value | Strategic Significance |
|---|---|---|
| Digital Share of Total Advertising | 68.7% – 76% | Digital channels dominate global media budgets |
| Total Digital Advertising Spend | $570B – $786B | Major shift from legacy advertising formats |
| Average Consumer Media Time on Digital Platforms | ~40% of total media time | Growing digital audience engagement |
| Programmatic Share of Digital Advertising | 80% – 90% | Automation becoming standard buying method |
The data illustrates how digital advertising has become the primary infrastructure for brand communication, product discovery, and consumer engagement.
Programmatic Advertising as the Default Operating Model
Within the digital advertising ecosystem, programmatic technology has emerged as the dominant transaction framework. Programmatic advertising refers to the automated buying and selling of advertising inventory through software-driven systems that optimize campaigns in real time.
By 2026, programmatic advertising accounts for more than four-fifths of all digital advertising investments globally. In the United States, this figure approaches ninety percent, demonstrating the near-total transition toward automated media buying.
The appeal of programmatic systems lies in their ability to deliver highly targeted campaigns while continuously optimizing performance using algorithmic decision-making.
Programmatic Advertising Market Structure
| Programmatic Advertising Indicator | 2026 Forecast | Industry Implication |
|---|---|---|
| Global Programmatic Share of Digital Spend | 80%+ | Automation dominates media buying |
| US Programmatic Share | ~90% | Mature programmatic ecosystem |
| US Programmatic Display Spend | $436 Billion | Largest automated advertising market |
| Real-Time Bidding Share | ~55% of programmatic spend | Auction-based inventory dominates |
Real-time bidding (RTB) has become the primary mechanism through which digital advertising inventory is traded. In this system, advertisers compete in automated auctions to display advertisements to specific users based on behavioral data, location signals, and browsing patterns.
However, the expansion of automated advertising infrastructure has also introduced new operational challenges.
Advertising Fraud and Trust Infrastructure
One of the most significant challenges associated with large-scale programmatic ecosystems is the prevalence of advertising fraud. Fraudulent traffic, bot-generated impressions, and manipulated click data create financial losses for advertisers operating within open advertising exchanges.
Industry estimates suggest that advertising fraud costs U.S. advertisers approximately 15.9 billion dollars annually. As a result, organizations have begun allocating additional budgets toward verification technologies and brand safety tools.
Advertising Fraud and Verification Ecosystem
| Challenge Area | Impact on Advertisers | Mitigation Strategy |
|---|---|---|
| Bot Traffic | Artificial inflation of ad impressions | Fraud detection platforms |
| Invalid Click Activity | Distorted campaign performance metrics | Click verification systems |
| Domain Spoofing | Ads appearing on unauthorized websites | Supply chain authentication |
| Brand Safety Risks | Ads placed near inappropriate content | Contextual analysis and moderation tools |
These verification layers have become a necessary component of digital advertising infrastructure, ensuring that marketing investments reach genuine audiences.
Mobile Advertising: The Primary Gateway to Consumers
Mobile devices have emerged as the dominant interface through which consumers access digital media. Smartphones now function as the central hub for communication, entertainment, shopping, and information discovery.
As a result, the majority of digital advertising impressions are now delivered through mobile environments. In 2026, approximately sixty-nine percent of global advertising spend is generated through mobile devices.
Mobile platforms have become particularly influential within social media ecosystems, where over eighty percent of user interactions occur through smartphone applications.
Mobile Advertising Market Indicators
| Mobile Advertising Metric | 2026 Estimate | Market Implication |
|---|---|---|
| Share of Global Ad Spend via Smartphones | 69% | Mobile devices dominate digital advertising delivery |
| Social Media Access via Mobile | 80%+ | Mobile-first social engagement |
| Average Consumer Screen Time on Smartphones | Increasing annually | Growing mobile advertising inventory |
This mobile-first environment has significantly influenced the types of advertising content that brands produce. Traditional horizontal video formats and static display advertisements are increasingly being replaced by vertical, mobile-native content formats.
The Expansion of Video and Social Media Advertising
Video advertising represents one of the most rapidly expanding segments of the digital marketing ecosystem. Improvements in mobile internet speeds, widespread smartphone adoption, and the popularity of streaming platforms have created ideal conditions for video-based brand communication.
Short-form video content in particular has become a dominant advertising format, driven by platforms that emphasize rapid content discovery and algorithmic content distribution.
Digital Advertising Format Performance in 2026
| Advertising Format | Projected 2026 Spend | Growth Trend | Engagement Advantage |
|---|---|---|---|
| Video Advertising | $188.76 Billion | 34.5% Year-over-Year Growth | 120% higher engagement vs static formats |
| Social Media Advertising | $317.33 Billion | 10.9% CAGR | Average engagement around 1.8% |
| Search Advertising | $220.00 Billion | +8.2% Year-over-Year | High purchase intent signals |
| Retail Media Advertising | $130.00 Billion | +22% Year-over-Year | Conversion rates above 5.2% |
Video content delivers significantly higher engagement compared with traditional advertising formats. Audiences are more likely to interact with dynamic content that combines entertainment, storytelling, and product demonstrations.
Short-form video formats, popularized by social platforms and streaming services, are particularly effective at capturing consumer attention within mobile-first environments.
Short-Form Video and Discovery-Based Marketing
Platforms focused on short-form video content have fundamentally reshaped the discovery process for brands. Rather than relying on consumers actively searching for products, these platforms use algorithmic recommendation systems to expose users to new content and products during routine browsing.
Short-form video advertisements on platforms such as TikTok, Instagram Reels, and YouTube Shorts generate engagement rates approximately seventy percent higher than traditional video advertisements.
Short-Form Video Advertising Performance
| Platform Type | Content Format | Engagement Advantage | Conversion Performance |
|---|---|---|---|
| Short-Form Video Platforms | Vertical mobile video | 70% higher engagement | Strong impulse discovery |
| Traditional Video Platforms | Horizontal streaming video | Moderate engagement | Brand storytelling focus |
| Static Display Advertising | Banner and image ads | Lower interaction rates | Limited engagement |
Video-driven social platforms have also demonstrated strong conversion performance. For example, certain short-form video ecosystems convert nearly forty-four percent of active users into buyers after exposure to product-focused content.
This trend signals a significant shift in marketing strategy.
The Transition from Intent-Based to Discovery-Based Advertising
Historically, digital advertising strategies relied heavily on intent-based marketing channels such as search engines. These platforms captured consumers who were already actively searching for specific products or services.
However, the rise of algorithmic content discovery systems has introduced a new paradigm known as discovery-based marketing.
Comparison of Advertising Strategy Models
| Marketing Model | Consumer Behavior Trigger | Primary Media Channels | Strategic Outcome |
|---|---|---|---|
| Intent-Based Marketing | Active product search | Search engines | High conversion but limited discovery |
| Discovery-Based Marketing | Algorithm-driven content exposure | Social media and short-form video | Expanded product awareness and impulse purchasing |
As short-form video platforms continue gaining popularity, advertising investment is shifting toward discovery-driven content ecosystems. Industry forecasts suggest that mobile video advertising spend may surpass search advertising expenditure for the first time in 2026.
This milestone represents a pivotal change in digital marketing strategy, where brands increasingly prioritize engaging storytelling and algorithmic discovery rather than relying solely on consumer search intent.
In the evolving advertising landscape, the combination of programmatic automation, mobile dominance, and video-driven engagement is reshaping how marketers connect with audiences worldwide. Digital ecosystems are no longer simply channels for advertising delivery; they have become integrated marketplaces where content, commerce, and community interaction converge.
4. Retail Media: The High-Margin Frontier of Integrated Commerce
Retail Media Networks (RMNs) have rapidly become one of the most influential and fastest-growing segments within the global advertising ecosystem. By 2026, retail media is widely recognized as the “third wave” of digital advertising, following the earlier dominance of search marketing and social media advertising.
This growth is driven by a unique structural advantage: the ability to connect advertising exposure directly to verified purchase behavior. Retail media platforms operate within commerce ecosystems where the same company controls consumer traffic, purchase data, and advertising inventory. This integration allows advertisers to measure the full consumer journey from impression to transaction, a capability commonly referred to as closed-loop attribution.
Global retail media spending is expected to reach between 165 billion and 200 billion dollars in 2026, compared with approximately 122 billion dollars just two years earlier. This rapid expansion reflects a fundamental shift in how brands prioritize high-intent consumer environments where advertising exposure occurs close to the point of purchase.
Retail Media Market Growth Overview
| Retail Media Metric | 2024 Estimated Value | 2026 Forecast | Strategic Implication |
|---|---|---|---|
| Global Retail Media Spend | $122 Billion | $165B – $200B | Fastest-growing digital advertising channel |
| Annual Growth Rate | — | 14.1% – 22% | Rapid expansion of commerce-driven advertising |
| Retail Media Share of Digital Budgets | Increasing steadily | Significant allocation among consumer brands | High conversion marketing channel |
Retail media networks have become particularly attractive to advertisers because they operate within environments where consumers are already actively shopping. This proximity to purchase significantly increases conversion rates compared with traditional display advertising.
Retailers Transforming into Media Companies
A defining characteristic of the retail media boom is the transformation of large retailers into powerful advertising platforms. Retailers possess a vast repository of first-party shopper data, including browsing patterns, purchase histories, product preferences, and location signals.
This data allows retailers to build highly precise audience segments that advertisers can target with personalized promotions.
For retailers themselves, advertising has become an extremely profitable business line. Traditional retail operations often operate on narrow profit margins due to logistics costs, inventory management, and competitive pricing pressures. In contrast, retail media advertising can generate operating margins between fifty percent and seventy percent.
Retailer Business Model Transformation
| Business Component | Traditional Retail Model | Retail Media-Integrated Model |
|---|---|---|
| Primary Revenue Source | Product sales | Product sales plus advertising revenue |
| Data Utilization | Inventory and customer analytics | Monetized shopper insights |
| Profit Margins | Low to moderate | High-margin advertising services |
| Consumer Engagement | In-store and online shopping | Integrated commerce and advertising ecosystem |
European retailers have been particularly aggressive in developing retail media capabilities. By monetizing advertising inventory across their websites, mobile apps, and physical stores, these companies are creating entirely new revenue streams that offset the thin margins associated with retail operations.
Brand Participation in Retail Media Ecosystems
Retail media networks attract two main categories of advertisers: endemic brands and non-endemic brands.
Endemic advertisers are brands whose products are directly sold within the retailer’s platform, such as consumer packaged goods (CPG) companies, electronics manufacturers, and home goods brands. These advertisers rely heavily on retail media to influence shoppers already browsing for products.
Non-endemic advertisers, on the other hand, use retail media networks to reach highly specific consumer audiences even if their products are not sold directly through the retailer.
Retail Media Advertiser Categories
| Advertiser Type | Description | Typical Marketing Objective |
|---|---|---|
| Endemic Brands | Brands selling products within the retailer’s marketplace | Increase product visibility and conversion |
| Non-Endemic Brands | Brands advertising to retail audiences without direct product listings | Access high-intent consumer segments |
Consumer packaged goods companies are among the most active participants in retail media ecosystems. In many cases, these brands allocate nearly thirty-nine percent of their total advertising budgets to retail media platforms, reflecting the strong return on investment associated with commerce-driven advertising.
Expansion Beyond On-Site Advertising
The early phase of retail media focused primarily on on-site advertising placements. These placements include sponsored product listings, banner advertisements on retailer websites, and promoted products within search results on e-commerce platforms.
However, the retail media ecosystem has rapidly expanded beyond these initial formats.
Retailers are now using their shopper data to target consumers across a broader range of digital environments, including third-party websites, mobile applications, and connected television platforms. This approach is known as off-site retail media.
Retail Media Channel Expansion
| Retail Media Format | Advertising Location | Growth Trend |
|---|---|---|
| On-Site Retail Media | Retailer websites and mobile apps | Stable growth |
| Off-Site Retail Media | Third-party websites and streaming platforms | Rapid expansion |
| In-Store Retail Media | Physical retail environments | Emerging high-growth segment |
Off-site retail media campaigns are currently expanding at nearly twice the pace of traditional on-site retail advertising. By combining shopper data with programmatic advertising technologies, retailers can extend their audience targeting capabilities across the broader internet while maintaining purchase-based targeting accuracy.
Retail Media Market Forecast
| Retail Media Segment | 2025 Value | 2026 Forecast | Long-Term Growth Trend |
|---|---|---|---|
| Global RMN Market | $184 Billion | $200 Billion | CAGR of approximately 12.4% through 2031 |
| United States RMN Market | $62 Billion | $69.33 Billion | Strong annual growth |
| In-Store Digital Signage | $0.5 Billion | $0.6 Billion | Continued retail digitization |
| Off-Site Retail Media Advertising | $10.64 Billion | $13.52 Billion | CAGR above 27% |
These figures highlight the accelerating diversification of retail media formats and the growing importance of integrated commerce advertising strategies.
The Resurgence of In-Store Advertising
One of the most innovative developments in retail media is the resurgence of in-store advertising. Physical retail environments are increasingly being transformed into dynamic digital media spaces that combine data-driven advertising with experiential consumer engagement.
Technologies such as digital screens, interactive kiosks, and AI-powered checkout displays are creating new opportunities for brands to influence purchase decisions inside physical stores.
In-Store Retail Media Technologies
| Technology Format | Description | Consumer Engagement Impact |
|---|---|---|
| Digital Entrance Screens | High-visibility displays at store entrances | Immediate product awareness |
| Interactive End-Caps | Smart shelving units with digital displays | Enhanced product discovery |
| AI-Powered Checkout Screens | Personalized promotions during payment | Last-minute purchase influence |
| Interactive Product Kiosks | Touchscreen product information systems | Higher consumer interaction |
These technologies allow retailers to combine physical shopping experiences with digital targeting capabilities.
Consumer Behavior Impact of In-Store Advertising
Recent behavioral studies highlight the powerful influence of in-store digital media. Advertising messages placed at strategic locations within physical stores often produce immediate purchasing decisions.
In-store advertising performance metrics show that approximately fifty-eight percent of shoppers who see a promotional message on a digital screen at the front entrance proceed to purchase the advertised product during the same visit.
Interactive kiosks also demonstrate strong engagement performance, increasing customer interaction rates by approximately fifty percent by allowing shoppers to explore product information, reviews, and personalized recommendations.
In-Store Retail Media Performance Metrics
| Retail Media Placement | Observed Consumer Behavior | Measured Impact |
|---|---|---|
| Entrance Digital Screens | Shoppers exposed during store entry | 58% purchase likelihood |
| Interactive Product Kiosks | Personalized product browsing | 50% higher engagement |
| Digital Shelf Displays | Product-level promotional visibility | Increased impulse purchases |
These developments signal a broader transformation in the retail environment. Physical stores are evolving from purely transactional spaces into immersive media environments where brands can engage consumers throughout the shopping journey.
Strategic Importance of Retail Media in Modern Marketing
Retail media networks represent one of the most strategically valuable advertising channels in the modern marketing landscape. Their unique combination of commerce data, purchase attribution, and consumer proximity gives advertisers an unprecedented level of insight into how advertising influences buying behavior.
Retail Media Strategic Advantage Matrix
| Strategic Advantage | Explanation | Marketing Outcome |
|---|---|---|
| Closed-Loop Attribution | Direct link between ad exposure and purchase | Accurate return on ad spend measurement |
| First-Party Shopper Data | Proprietary customer behavior insights | Highly targeted campaigns |
| Commerce Proximity | Advertising within shopping environments | Higher conversion rates |
| Omnichannel Reach | Integration of online and offline advertising | Full-funnel consumer engagement |
As retail media networks continue expanding across digital and physical environments, they are increasingly positioned as one of the most powerful growth engines within the global advertising industry.
The integration of commerce data, programmatic technology, and in-store digital innovation is transforming retailers into major advertising platforms. In the evolving marketing landscape of 2026, retail media stands at the intersection of media, commerce, and consumer behavior, redefining how brands influence purchasing decisions.
5. The AI Supercycle: Reallocating Capital for Productivity and Revenue
Artificial Intelligence has emerged as one of the most influential forces shaping the global economy in 2026. What began as experimental adoption across industries has now matured into a full-scale technology investment cycle. This transformation is often described as the “AI Supercycle,” a period in which organizations across sectors are rapidly reallocating capital toward artificial intelligence infrastructure, software, and automation capabilities.
Global investment in AI technologies is projected to expand dramatically, rising from approximately 1.5 trillion dollars in 2025 to roughly 2.52 trillion dollars in 2026. This represents an extraordinary year-over-year growth rate of approximately 44 percent. Such growth illustrates how artificial intelligence is no longer viewed as a peripheral innovation but rather as a foundational component of modern digital operations.
For marketing teams in particular, AI has transitioned from experimental pilot projects into mission-critical production systems. The majority of organizations have now embedded AI tools into their daily marketing workflows, enabling automation across campaign management, audience targeting, and content creation.
Global Artificial Intelligence Investment Expansion
| AI Investment Indicator | 2025 Estimated Value | 2026 Forecast | Strategic Impact |
|---|---|---|---|
| Global AI Investment | $1.5 Trillion | $2.52 Trillion | Massive acceleration of AI adoption |
| Year-over-Year Growth | — | +44% | Rapid capital reallocation toward AI infrastructure |
| Organizational AI Adoption Rate | Approximately 65% | 78% of organizations | AI integrated into daily business operations |
The data reflects a significant shift in how businesses approach digital transformation. Artificial intelligence is no longer considered a future capability but rather an immediate competitive requirement.
Revenue Growth and Business Performance Impact
Beyond technological adoption, artificial intelligence is generating measurable financial returns for organizations that deploy it effectively. Companies across industries report strong correlations between AI implementation and revenue expansion.
A large majority of organizations indicate that AI initiatives have directly contributed to increased annual revenue. In many cases, these gains are not marginal improvements but meaningful growth in business performance.
AI-Driven Revenue Impact
| Business Outcome | Percentage of Organizations | Performance Impact |
|---|---|---|
| Organizations Reporting Revenue Increase from AI | 88% | Positive financial impact from AI adoption |
| Executives Reporting Revenue Growth Above 10% | 40%+ | Significant business expansion |
| Companies Using AI for Marketing Automation | Growing majority | Increased campaign efficiency |
Artificial intelligence enables companies to analyze large volumes of consumer data, predict purchasing behavior, and deliver personalized marketing experiences at scale. These capabilities significantly improve the effectiveness of marketing investments.
Operational Efficiency and Cost Optimization
In addition to revenue growth, artificial intelligence is generating substantial operational efficiencies across marketing departments. Automated workflows, predictive analytics, and AI-powered content generation tools are reducing manual workloads while improving output quality.
A large proportion of organizations report measurable cost reductions associated with AI-driven automation.
AI Impact on Operational Efficiency
| Efficiency Category | Percentage of Organizations | Measurable Impact |
|---|---|---|
| Organizations Reporting Cost Reductions | 87% | Lower operational expenses |
| Companies Achieving Cost Reduction Above 10% | Approximately 25% | Significant operational savings |
| Businesses Reporting Productivity Improvements | Majority of adopters | Faster marketing execution |
These efficiencies allow marketing teams to shift resources away from repetitive operational tasks toward higher-value strategic activities such as brand development, creative experimentation, and customer experience design.
Productivity Gains Across the Marketing Workforce
One of the most visible effects of AI adoption is the dramatic increase in workforce productivity. Marketing professionals are using AI-powered tools to streamline tasks such as content generation, data analysis, keyword research, and campaign optimization.
On average, marketers report saving approximately thirteen hours per week through the use of AI-driven tools and automation platforms. This improvement translates into a productivity increase of approximately forty-four percent.
Marketing Productivity Gains from AI
| Productivity Indicator | Average Improvement | Economic Impact |
|---|---|---|
| Weekly Time Saved by Marketers | 13 hours | Significant operational efficiency |
| Productivity Increase | 44% improvement | Accelerated marketing output |
| Estimated Global Economic Value | — | Approximately $4.4 Trillion |
These productivity gains are not limited to individual organizations. When aggregated across industries and global markets, AI-driven efficiency improvements are estimated to contribute trillions of dollars to the global economy.
AI-Powered Content Production at Scale
Another major area of impact is the expansion of content production capabilities. Artificial intelligence tools enable marketing teams to generate, refine, and distribute content across multiple channels far more quickly than traditional workflows allow.
Companies using AI-assisted content systems report the ability to publish significantly more marketing material without expanding their teams.
AI Influence on Content Production
| Content Production Metric | AI Impact | Marketing Advantage |
|---|---|---|
| Increase in Monthly Content Output | 42% increase | Greater brand visibility |
| Marketers Using AI for Content Creation | 93% | Faster production cycles |
| Content Personalization Capability | High scalability | Improved audience targeting |
By automating elements of content development, organizations can maintain a constant flow of material across websites, social media platforms, video channels, and retail marketplaces.
The Emergence of Agentic Artificial Intelligence
While early AI tools focused primarily on assisting human decision-making, the next stage of development involves autonomous systems capable of executing complex marketing operations independently. This new generation of technology is commonly referred to as Agentic AI.
Agentic AI systems function as autonomous digital agents capable of performing multi-step marketing tasks. These agents can analyze campaign performance, identify optimization opportunities, adjust media bids, and refine audience segmentation in real time.
Agentic AI Capabilities in Marketing Operations
| AI Capability | Functional Role | Marketing Outcome |
|---|---|---|
| Autonomous Campaign Management | Automatic adjustment of campaign settings | Continuous optimization |
| Audience Segmentation | Behavioral pattern analysis | Precision targeting |
| Real-Time Performance Monitoring | Continuous data analysis | Immediate optimization actions |
| Cross-Channel Coordination | Unified campaign orchestration | Integrated marketing strategy |
Nearly eighty-eight percent of business executives indicate that their organizations plan to increase AI investment specifically to support agentic capabilities.
These systems represent a shift from AI as a supportive tool toward AI as an autonomous decision-making infrastructure embedded within marketing operations.
Investment in AI Infrastructure and Cloud Systems
The growing sophistication of AI models requires substantial technological infrastructure. Advanced machine learning systems rely on powerful computing environments capable of processing large volumes of data in real time.
As a result, many organizations are increasing spending on AI-optimized servers, cloud computing platforms, and specialized data center architectures.
AI Infrastructure Investment Priorities
| Infrastructure Category | Percentage of Organizations Investing | Strategic Objective |
|---|---|---|
| AI-Optimized Servers | 31% | Support high-performance machine learning models |
| Cloud Data Centers | Growing enterprise adoption | Scalable data processing |
| AI Training Infrastructure | Increasing investment | Continuous model improvement |
These investments ensure that organizations can support the computational demands of next-generation artificial intelligence systems.
The Rise of AI-Oriented Search Optimization
Another emerging consequence of the AI supercycle is the transformation of search visibility. As AI-powered search engines and conversational assistants become more widely used, brands must adapt their digital strategies to ensure visibility within AI-generated answers and recommendation systems.
This shift has given rise to a new discipline sometimes described as “SEO for AI,” which focuses on optimizing content to appear within AI-generated search summaries, conversational responses, and recommendation engines.
AI Search Optimization Investment Trends
| Optimization Category | Percentage of Businesses Increasing Investment | Strategic Goal |
|---|---|---|
| SEO for AI Systems | 61.2% | Ensure brand visibility within AI-generated answers |
| Structured Data Implementation | Increasing adoption | Improve machine readability of content |
| Knowledge Graph Optimization | Expanding focus | Strengthen brand authority signals |
These strategies reflect the evolving nature of search discovery. Rather than simply ranking within traditional search results pages, brands must now compete for visibility within AI-generated responses that summarize information directly for users.
Strategic Implications of the AI Supercycle
The rapid expansion of artificial intelligence investment signals a fundamental shift in how organizations approach productivity, innovation, and competitive strategy. For marketing leaders, AI is rapidly becoming the backbone of modern digital operations.
AI Marketing Strategy Impact Matrix
| Strategic Area | AI-Driven Transformation | Business Outcome |
|---|---|---|
| Marketing Automation | Autonomous campaign execution | Improved efficiency and scalability |
| Consumer Intelligence | Predictive analytics and data modeling | More precise audience targeting |
| Content Development | AI-assisted creative production | Faster and larger content pipelines |
| Media Optimization | Real-time algorithmic bidding | Higher advertising performance |
As the AI supercycle continues to accelerate, organizations that integrate artificial intelligence deeply into their marketing ecosystems will likely gain a substantial competitive advantage. AI is no longer simply enhancing marketing processes; it is redefining how businesses generate revenue, manage productivity, and interact with consumers in an increasingly automated digital economy.
6. Social Media Platform Dynamics and the Creator Economy
Social media platforms continue to represent one of the most influential pillars of the global advertising ecosystem. By 2026, global social media advertising expenditure is projected to exceed 317 billion dollars, with sustained annual growth estimated at approximately 10.9 percent through the end of the decade.
This expansion is largely driven by the unparalleled scale of audience attention captured by major platforms. Billions of users interact with social networks daily, creating environments where brands can communicate directly with consumers through personalized, algorithm-driven content feeds.
In addition to scale, social platforms provide advertisers with precise targeting capabilities powered by user behavior data, interest signals, and real-time engagement metrics. These capabilities allow marketers to optimize campaigns quickly while measuring the direct impact of advertising investments.
Global Social Media Advertising Growth Indicators
| Metric | 2026 Forecast | Strategic Significance |
|---|---|---|
| Global Social Media Advertising Spend | $317 Billion+ | One of the largest digital advertising segments |
| Annual Growth Rate | 10.9% | Sustained expansion through 2030 |
| Primary Drivers | Platform engagement, creator economy, mobile video | Increasing advertiser confidence |
Social media platforms function not only as advertising channels but also as entertainment ecosystems, commerce platforms, and community networks. This combination of roles significantly enhances their influence over consumer discovery and purchasing decisions.
Major Social Media Platforms and Advertising Performance
The social media ecosystem is dominated by a handful of large platforms that collectively capture the majority of global audience attention. Each platform offers distinct advantages in terms of audience reach, advertising performance, and marketing objectives.
Leading Social Media Platforms and Advertising Metrics
| Platform | Monthly Active Users (MAU) | Average ROI (Return per $1) | Key Marketing Metric |
|---|---|---|---|
| 3.1 Billion | $5.20 | Approximately 9.2% conversion rate | |
| YouTube | 2.9 Billion | $4.00 – $5.00 | Reaches roughly 90% of audiences aged 18–44 |
| 2.8 Billion | N/A | Dominant global messaging platform | |
| 2.3 Billion | $5.20 | 35% of user time spent on Reels | |
| TikTok | 1.6 – 1.99 Billion | $5.20 – $10.00+ | Average engagement rate around 5.3% |
| 1.0 Billion | High B2B conversion value | Approximate CPC around $5.26 | |
| X (Twitter) | 660 Million | 28% positive ROI | Engagement rate approximately 0.04% |
These figures illustrate the immense scale and diversity of social media ecosystems. Platforms differ in their primary use cases, audience demographics, and advertising performance, which leads marketers to deploy distinct strategies depending on campaign objectives.
Short-Form Video Platforms Driving Engagement
Short-form video has become one of the most powerful formats for audience engagement across social media platforms. Platforms that prioritize video discovery through algorithmic recommendation engines are capturing increasing shares of both user attention and advertising budgets.
TikTok, Instagram Reels, and YouTube Shorts have fundamentally changed how audiences consume content. These platforms rely on algorithmic feeds that introduce users to new creators, brands, and products without requiring explicit search behavior.
Short-Form Video Platform Impact
| Platform Type | Core Content Format | Engagement Characteristics | Advertising Advantage |
|---|---|---|---|
| TikTok | Vertical short-form video | High engagement and rapid discovery | Strong conversion potential |
| Instagram Reels | Short mobile video integrated with social feeds | High user time spent | Seamless commerce integration |
| YouTube Shorts | Mobile video linked to long-form video ecosystem | Broad audience reach | Strong brand storytelling potential |
Among these platforms, TikTok has emerged as one of the most influential advertising environments for influencer-driven marketing campaigns. Approximately sixty-three percent of marketers identify TikTok as the platform delivering the highest return on investment.
As a result, TikTok is widely regarded as the top social platform where marketing budgets are expected to increase most significantly during 2026.
Instagram and the Expansion of Social Commerce
Instagram continues to maintain its position as a major commercial platform within the social media ecosystem. The platform’s integration of social content, influencer partnerships, and embedded shopping experiences makes it particularly effective for product discovery and retail promotion.
User engagement has increasingly shifted toward short-form video formats such as Instagram Reels, which now accounts for approximately thirty-five percent of user time spent on the platform.
Instagram Advertising and Commerce Indicators
| Metric | Current Value | Marketing Implication |
|---|---|---|
| Monthly Active Users | Approximately 2.3 Billion | Large global advertising reach |
| Time Spent on Reels | 35% of platform engagement | Video-driven discovery |
| Social Commerce Integration | High | Direct product purchase capability |
Industry forecasts suggest that Instagram’s user base may approach three billion active users by early 2026, reinforcing its status as one of the most commercially powerful social media environments.
LinkedIn and the Rise of B2B Social Advertising
While many social platforms focus on entertainment and lifestyle content, LinkedIn has emerged as the leading platform for business-to-business marketing. Its professional audience and industry-specific targeting capabilities make it particularly valuable for organizations seeking to reach corporate decision-makers.
LinkedIn’s advertising costs tend to be higher than those of consumer-focused social platforms, but the platform compensates with exceptionally strong conversion performance.
B2B Social Media Advertising Comparison
| Platform | Target Audience | Advertising Advantage | Marketing Objective |
|---|---|---|---|
| Professionals and executives | High conversion rates for B2B campaigns | Lead generation and enterprise sales | |
| Broad consumer audience | Large-scale reach | Brand awareness | |
| Lifestyle-oriented consumers | Visual commerce integration | Product promotion |
For companies operating in technology, consulting, finance, and enterprise services, LinkedIn remains the most reliable platform for generating qualified leads and nurturing long-term professional relationships.
The Professionalization of Influencer Marketing
Parallel to the rise of social media advertising is the rapid growth of the global creator economy. Influencer marketing has evolved from informal brand partnerships into a highly structured industry with measurable performance outcomes.
In 2026, the global influencer marketing sector is estimated to be worth between 32.55 billion and 35.1 billion dollars. This growth reflects increasing advertiser confidence in creator-driven campaigns that combine authenticity, storytelling, and audience trust.
Influencer Marketing Industry Growth
| Metric | 2026 Estimate | Strategic Significance |
|---|---|---|
| Global Influencer Marketing Market | $32.55B – $35.1B | Major component of social advertising |
| Average ROI | $5.78 – $6.93 per $1 spent | High marketing efficiency |
| Preferred Campaign Structure | Long-term partnerships | Stronger audience trust |
One of the most effective campaign structures involves long-term brand ambassador programs lasting six months or longer. These partnerships allow influencers to develop consistent narratives around a brand, leading to stronger audience credibility and higher engagement.
Long-term influencer collaborations can generate returns of approximately $11.28 for every dollar invested.
The Shift Toward Smaller Creator Tiers
A notable trend within influencer marketing is the increasing preference for smaller creators who maintain highly engaged communities. While large influencers offer substantial reach, smaller creators often achieve significantly higher engagement rates and stronger audience trust.
Brands are therefore shifting their strategies toward nano-influencers and micro-influencers who cultivate closer relationships with their followers.
Influencer Tier Performance Comparison
| Influencer Tier | Follower Range | Instagram Engagement | TikTok Engagement | Estimated Deliverable Cost |
|---|---|---|---|---|
| Nano Influencers | 1K – 10K | 6.23% | 15.2% | £50 – £200 |
| Micro Influencers | 10K – 100K | 3.86% | 8.7% | £200 – £1,000 |
| Mid-Tier Influencers | 100K – 500K | 1.80% – 2.5% | 7.5% | £1,000 – £5,000 |
| Mega Influencers | 1M+ | 0.92% – 0.98% | 7.1% | High premium pricing |
Nano-influencers consistently demonstrate the highest engagement levels, particularly on platforms such as TikTok where community interaction plays a central role in content distribution.
As a result, approximately forty-four percent of brands now prioritize partnerships with nano-creators, while roughly twenty-five percent focus on micro-influencers.
Strategic Role of the Creator Economy in Modern Marketing
The creator economy has become a central component of digital marketing strategies. Influencers act as trusted intermediaries between brands and audiences, providing authentic product recommendations within content environments that consumers already trust.
Creator Economy Strategic Impact
| Strategic Advantage | Description | Marketing Outcome |
|---|---|---|
| Authentic Brand Advocacy | Influencers build trust with audiences | Higher credibility |
| Targeted Community Reach | Niche audiences within specific interests | Improved engagement |
| Scalable Content Production | Creators produce high-volume content | Continuous brand visibility |
| Social Commerce Integration | Direct purchase links within content | Increased conversion rates |
The continued expansion of social media platforms, combined with the rapid professionalization of the creator economy, has transformed influencer marketing into a central pillar of digital advertising.
In 2026, successful marketing strategies increasingly rely on the integration of platform-driven advertising, short-form video content, and long-term creator partnerships. This convergence is reshaping how brands build relationships with audiences and how consumers discover and purchase products in the digital age.
7. B2B and Sector-Specific Budgetary Benchmarks
Marketing budget allocation in 2026 varies significantly depending on the industry sector, the maturity of the company, and the underlying business model. While global marketing expenditure continues to expand alongside digital transformation and AI-driven marketing systems, companies remain highly strategic about how they distribute marketing resources relative to revenue.
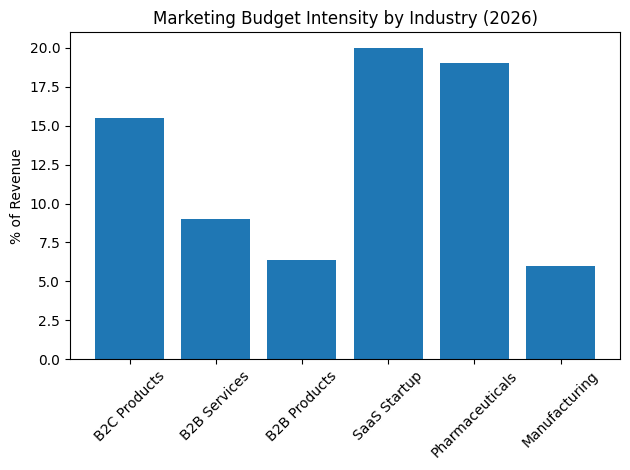
Across all industries, the average marketing budget in 2026 represents approximately 7.7 percent to 9.4 percent of total company revenue. However, this average masks substantial variation between sectors. Companies operating in highly competitive or innovation-driven markets often allocate a significantly larger share of revenue to marketing in order to sustain growth, acquire customers, and maintain market visibility.
Industries such as software-as-a-service, consumer goods, and pharmaceuticals often exhibit higher marketing intensity due to aggressive customer acquisition strategies, regulatory education requirements, and rapid product innovation cycles.
Average Marketing Budget Allocation by Industry Category
| Industry Category | Average Marketing Budget (% of Revenue) | Strategic Marketing Objective |
|---|---|---|
| Cross-Industry Average | 7.7% – 9.4% | Balanced brand building and performance marketing |
| High-Growth Technology Sectors | 12% – 25% | Market expansion and user acquisition |
| Mature Industrial Sectors | 5% – 7% | Lead qualification and relationship development |
| Regulated Industries | 12% – 21% | Education, compliance, and professional outreach |
These variations illustrate how marketing investment intensity often reflects the complexity of the customer journey, the level of market competition, and the speed of product adoption cycles.
The Strategic Evolution of B2B Marketing Models
Business-to-business organizations are undergoing a strategic shift in how they structure marketing investments. Historically, many B2B marketing strategies focused primarily on direct sales support and short-term lead generation.
However, in 2026 B2B leaders increasingly recognize that strong brand credibility plays a critical role in influencing complex purchasing decisions involving multiple stakeholders. Enterprise purchasing cycles often involve technical evaluators, financial decision-makers, and executive leadership, making trust and reputation essential components of the marketing process.
As a result, many B2B organizations are adopting a balanced marketing allocation strategy that divides resources evenly between long-term brand building and short-term sales activation.
B2B Marketing Investment Model Evolution
| Marketing Strategy Model | Budget Allocation | Strategic Focus |
|---|---|---|
| Traditional B2C Model | 60% Brand / 40% Activation | Consumer awareness and short purchase cycles |
| Emerging B2B Model | 50% Brand / 50% Activation | Trust building and complex enterprise sales |
This shift reflects the growing understanding that brand authority strengthens long-term demand generation while improving the efficiency of performance marketing campaigns.
Marketing Budget Benchmarks by Sector and Business Model
Marketing budget intensity differs widely across sectors due to differences in customer acquisition cost, sales cycle length, and product complexity.
Industry-Specific Marketing Budget Benchmarks
| Sector or Business Model | Marketing Budget (% of Revenue) | Primary Digital Channel | Strategic Marketing Focus |
|---|---|---|---|
| B2C Consumer Products | 15.5% | Social Media and Retail Media | Brand awareness and customer acquisition |
| B2B Services | 9.0% | LinkedIn and SEO | Relationship development and trust |
| B2B Products | 6.4% | Search and Content Marketing | Sales enablement and product education |
| SaaS Startups | 15.0% – 25.0% | Search and LinkedIn | Market validation and rapid user growth |
| Mature SaaS Companies | 7.0% – 12.0% | Content marketing and industry events | Customer retention and upselling |
| Pharmaceutical Industry | 18.0% – 21.0% | Multi-channel outreach | Medical education and professional engagement |
| Healthcare Providers | 6.0% – 12.0% | Local SEO and paid search | Patient acquisition and service visibility |
| Manufacturing | 5.0% – 7.0% | SEO and video content | Lead qualification and product demonstration |
The table highlights how marketing budgets reflect the specific requirements of each industry. Consumer-focused industries typically allocate larger budgets to build brand visibility and drive customer acquisition, while industrial sectors emphasize targeted lead generation and relationship-based marketing.
Digital Transformation in B2B Advertising
Digital marketing channels now dominate B2B advertising strategies. In 2026, B2B digital advertising expenditure is expected to reach approximately 23 billion dollars globally. A large majority of this spending is concentrated within digital channels such as search advertising, content marketing platforms, and professional social networks.
Digital channels provide B2B marketers with the ability to target highly specific audiences based on job roles, company size, industry verticals, and behavioral data.
B2B Advertising Channel Distribution
| Advertising Channel | Share of B2B Marketing Spend | Strategic Benefit |
|---|---|---|
| Digital Advertising Channels | 70% – 72% | Precision targeting and measurable ROI |
| Industry Events and Conferences | Moderate share | Relationship building |
| Traditional Media | Declining share | Limited targeting capability |
The shift toward digital-first strategies allows B2B marketers to track performance metrics more accurately while optimizing campaigns in real time.
Return on Investment Across B2B Marketing Channels
One of the most important considerations in B2B marketing strategy is the return on investment generated by various channels. Data from recent industry benchmarks highlights substantial performance differences between marketing tactics.
Organic search, often implemented through search engine optimization (SEO), remains the most effective channel for generating long-term B2B marketing returns.
B2B Marketing Channel ROI Comparison
| Marketing Channel | Average Return on Investment | Strategic Advantage |
|---|---|---|
| Organic Search (SEO) | Approximately 748% ROI | Long-term inbound lead generation |
| Email Marketing | Approximately 261% ROI | High personalization and relationship nurturing |
| LinkedIn Advertising | Strong conversion rates | Access to professional audiences |
| Paid Search Advertising | Moderate ROI | High-intent lead capture |
Search-driven content strategies perform particularly well in B2B environments because decision-makers frequently conduct extensive research before selecting enterprise solutions or professional services.
Marketing Investment Patterns in SaaS Companies
Software-as-a-service companies represent one of the most marketing-intensive sectors in the digital economy. Customer acquisition costs are often high, and companies must continuously invest in marketing to maintain growth, reduce churn, and expand customer lifetime value.
SaaS companies backed by venture capital typically spend significantly more on marketing compared with companies that rely on self-funded growth strategies.
SaaS Marketing Investment Comparison
| SaaS Business Model | Marketing Budget Strategy | Competitive Implication |
|---|---|---|
| Venture-Backed SaaS | Aggressive marketing investment | Rapid market penetration |
| Bootstrapped SaaS | Conservative marketing budgets | Gradual organic growth |
On average, venture-backed SaaS companies spend approximately 58 percent more on marketing than their bootstrapped counterparts. This aggressive spending allows them to scale faster, dominate market share, and maintain competitive momentum within rapidly evolving technology markets.
Strategic Implications for Marketing Leaders
The marketing budget landscape in 2026 demonstrates that there is no universal benchmark that applies equally across all industries. Instead, successful organizations tailor their marketing investments according to their specific growth strategies, market maturity, and customer acquisition economics.
Marketing Budget Strategy Matrix
| Organizational Goal | Recommended Marketing Focus | Key Channels |
|---|---|---|
| Rapid Market Expansion | Aggressive acquisition campaigns | Search, social media, and influencer marketing |
| Enterprise Sales Growth | Relationship-based marketing | LinkedIn, content marketing, and events |
| Customer Retention | Loyalty programs and content engagement | Email marketing and community platforms |
| Brand Authority Development | Thought leadership and storytelling | Video, podcasts, and long-form content |
The evolving marketing ecosystem requires organizations to continuously evaluate the efficiency of their marketing investments. Companies that align budget allocation with measurable outcomes, technological capabilities, and audience behavior will be better positioned to compete in the increasingly data-driven marketing environment of 2026.
8. MarTech Stack Economics and the Total Cost of Ownership
Marketing technology has evolved into a foundational component of modern business infrastructure. In 2026, the global MarTech market is projected to reach approximately 714.56 billion dollars, reflecting the growing reliance on technology-driven marketing operations. Platforms for customer relationship management, marketing automation, analytics, personalization, and data orchestration now play roles comparable to enterprise resource planning systems in finance or supply chain management in operations.
For marketing leaders, technology has become the operational backbone that enables data-driven decision-making, personalized customer experiences, and large-scale campaign automation. As a result, marketing departments are increasingly allocating larger portions of their budgets toward technology investments.
Industry surveys indicate that nearly eighty percent of marketing technology decision-makers expect their MarTech budgets to increase over the next three to five years. This growth is driven by the need to integrate artificial intelligence tools, customer data platforms, analytics systems, and omnichannel marketing automation.
Global MarTech Market Expansion
| MarTech Market Indicator | 2026 Projection | Strategic Significance |
|---|---|---|
| Global MarTech Market Size | $714.56 Billion | Technology embedded in core marketing operations |
| Organizations Increasing MarTech Budgets | ~80% | Continuous expansion of marketing infrastructure |
| Key Investment Areas | AI, data platforms, automation tools | Greater operational efficiency |
However, alongside this rapid expansion comes a growing financial challenge that many organizations underestimate.
The Hidden Cost Multiplier in Marketing Technology
One of the most persistent financial challenges associated with MarTech investments is the gap between expected costs and the actual total cost of ownership. Marketing leaders often focus primarily on software license fees when budgeting for technology platforms. In practice, however, license costs represent only a fraction of the total expenses associated with operating a full marketing technology stack.
The true total cost of ownership for most MarTech systems is typically two to three times higher than the initial licensing fees. Studies show that chief marketing officers frequently underestimate the total cost of their technology investments by between forty and sixty percent.
This discrepancy is commonly referred to as the “Hidden Cost Multiplier,” a phenomenon that emerges when organizations overlook expenses related to implementation, integration, data management, and operational staffing.
MarTech Investment Scale by Organization Size
| Organization Tier | Estimated License Fees | True Total Cost of Ownership | Typical Technology Stack Size |
|---|---|---|---|
| SMB (Under $50M Revenue) | $50K – $150K | $120K – $350K | 5 – 10 tools |
| Mid-Market ($50M – $500M Revenue) | $200K – $600K | $500K – $1.5M | 15 – 25 tools |
| Enterprise ($500M+ Revenue) | $800K – $3M+ | $2M – $8M+ | 30 – 50 tools |
As organizations grow in size and complexity, the number of marketing technology tools increases significantly. Large enterprises may operate dozens of interconnected systems covering customer data management, advertising automation, analytics, content management, and personalization.
The cumulative effect of these tools introduces operational complexity that requires specialized infrastructure and skilled personnel to maintain.
Implementation and Customization Costs
The first major cost component beyond software licensing involves the implementation and configuration of marketing platforms. Deploying large enterprise systems often requires significant customization to integrate with existing technology environments and align with company workflows.
For example, customer relationship management platforms frequently require extensive setup and configuration services.
Implementation Cost Benchmarks for Enterprise Marketing Platforms
| Platform Type | Basic Implementation Cost | Enterprise-Level Implementation |
|---|---|---|
| CRM Platforms | Starting around $25,000 | $150,000+ depending on complexity |
| Digital Experience Platforms | $100,000+ | $500,000+ for advanced deployments |
| Marketing Automation Systems | $30,000+ | $150,000+ including workflow configuration |
These implementation costs frequently involve external consulting firms, specialized system integrators, and internal IT teams working together to deploy the platform successfully.
Integration and System Maintenance
Modern marketing technology stacks rarely consist of a single platform. Instead, organizations operate interconnected systems that must exchange data across multiple environments.
However, native integrations provided by software vendors typically cover only about sixty percent of real-world integration requirements. As a result, companies must invest in additional middleware solutions or integration platforms to connect their technology ecosystems.
Integration Infrastructure and Maintenance Costs
| Integration Component | Annual Cost Range | Operational Purpose |
|---|---|---|
| Integration Platform as a Service (iPaaS) Tools | $10,000 – $50,000 per year | Connect multiple systems |
| Custom API Development | $20,000 – $80,000 | Specialized integrations |
| Integration Maintenance | $75,000 – $150,000 annually (mid-market firms) | Continuous system stability |
Platforms such as integration middleware solutions allow data to flow between marketing automation tools, analytics systems, CRM platforms, and data warehouses. Without these integrations, organizations cannot achieve the unified customer views required for modern marketing strategies.
Data Management and Migration Costs
Another often underestimated expense involves the management and movement of customer data across systems. Marketing technology platforms rely heavily on large volumes of structured and unstructured data, which must be cleaned, organized, and maintained over time.
Data migration projects—such as transferring records between customer relationship management systems or analytics platforms—can be expensive and technically complex.
Data Management Cost Structure
| Data Management Activity | Estimated Cost Range | Operational Impact |
|---|---|---|
| Data Migration Between Platforms | $20,000 – $100,000+ | System modernization |
| Data Cleansing and Deduplication | $50,000 – $200,000 | Improved data accuracy |
| Data Governance Implementation | Variable enterprise costs | Regulatory compliance and quality control |
These processes are not one-time activities. Data cleansing and deduplication initiatives must typically be repeated every two to three years to maintain data accuracy and usability.
Operational Staffing for MarTech Infrastructure
Marketing technology stacks also require specialized operational teams responsible for system administration, analytics management, and integration oversight. These professionals ensure that marketing systems function reliably while supporting campaign execution and reporting.
Mid-market organizations typically require between two and four full-time employees dedicated specifically to managing marketing technology operations.
MarTech Operations Staffing Requirements
| Organization Size | Required MarTech Staff | Estimated Annual Cost |
|---|---|---|
| Small Business | 1 specialist | $80,000 – $120,000 |
| Mid-Market Company | 2 – 4 specialists | $200,000 – $400,000 |
| Large Enterprise | Dedicated MarTech team | $500,000+ depending on team size |
These specialists often include marketing operations managers, marketing technologists, data engineers, and analytics experts who maintain the technology environment.
The Central Role of Customer Data Platforms
Within modern MarTech ecosystems, the Customer Data Platform (CDP) has emerged as the central hub that connects data sources, marketing channels, and analytics systems.
A CDP aggregates customer information from various sources such as websites, mobile applications, advertising platforms, and CRM systems. This unified data environment allows organizations to build comprehensive customer profiles and deliver personalized experiences across multiple channels.
Customer Data Platform Cost Structure
| CDP Component | Typical Cost Range | Strategic Purpose |
|---|---|---|
| Enterprise CDP License | $50,000 – $500,000+ annually | Centralized customer data management |
| Data Volume Scaling Fees | Variable pricing | Based on user events and traffic |
| Implementation Services | Often equal to first-year license cost | Platform configuration and integration |
Many CDP vendors structure their pricing based on the volume of tracked user events and the number of customer profiles stored within the platform. As organizations scale their digital operations, these usage-based pricing models can lead to substantial increases in operating costs.
Total Cost of Ownership in MarTech Strategy
Understanding the full cost structure of marketing technology is critical for effective financial planning. Organizations that focus exclusively on license costs often encounter budget overruns once implementation, integration, staffing, and data management costs are factored in.
MarTech Total Cost Structure Overview
| Cost Category | Typical Percentage of Total MarTech Spend | Strategic Role |
|---|---|---|
| Software Licensing | 30% – 40% | Core technology platforms |
| Implementation and Customization | 20% – 25% | System deployment |
| Integration and Middleware | 15% – 20% | Cross-platform connectivity |
| Data Management | 10% – 15% | Data quality and governance |
| Operational Staffing | 10% – 20% | System maintenance and optimization |
Organizations that successfully manage these costs often adopt strategic approaches such as consolidating redundant tools, standardizing data architectures, and prioritizing platforms that support open integrations.
As marketing operations become increasingly data-driven and AI-powered, MarTech investments will continue expanding. However, understanding the true total cost of ownership will remain essential for ensuring that technology investments deliver sustainable value rather than creating operational complexity.
9. Data Privacy, Compliance, and the First-Party Mandate
By 2026, data privacy and regulatory compliance have become central pillars of modern marketing strategy. What was once viewed as a legal or operational requirement has now evolved into a core competitive differentiator for brands. The gradual elimination of third-party cookies across major web browsers, combined with expanding regulatory frameworks around consumer data protection, has forced marketers to rethink how customer data is collected, stored, and activated.
The final stages of third-party cookie deprecation, alongside new privacy regulations such as the California Privacy Protection Act (CPPA), which came into full effect on January 1, 2026, have accelerated the global shift toward first-party data strategies. First-party data refers to information that organizations collect directly from their customers through owned channels such as websites, mobile applications, email interactions, and loyalty programs.
Consumer attitudes toward data privacy have also evolved significantly. Research indicates that approximately seventy-six percent of consumers are unwilling to purchase from companies they do not trust with their personal data. This growing sensitivity has transformed privacy alignment into a core element of brand reputation and customer loyalty.
Consumer Trust and Data Privacy Expectations
| Consumer Privacy Indicator | Observed Trend | Marketing Implication |
|---|---|---|
| Consumers Avoiding Brands Without Data Trust | 76% | Privacy transparency influences purchasing decisions |
| Decline of Third-Party Cookies | Ongoing global implementation | Shift toward first-party data strategies |
| Expansion of Privacy Regulations | Increasing worldwide | Compliance integrated into marketing operations |
These dynamics have pushed organizations to redesign their marketing data infrastructure around consent-driven data collection and privacy-safe analytics.
Regulatory Frameworks Reshaping Marketing Data Practices
Several major regulatory frameworks now govern how companies collect and process consumer data. Regulations such as the General Data Protection Regulation (GDPR) in Europe, the California Consumer Privacy Act (CCPA), and the updated CPPA framework in the United States impose strict requirements on data handling practices.
Organizations must now demonstrate transparency regarding how personal data is used while providing consumers with greater control over their information. This includes the ability to access stored data, request deletion, or withdraw consent for data processing.
Major Data Privacy Regulations Affecting Marketers
| Regulation | Geographic Scope | Key Compliance Requirement |
|---|---|---|
| GDPR | European Union | Explicit user consent and strict data protection rules |
| CCPA | California, United States | Consumer right to access and delete personal data |
| CPPA | United States (expanded framework) | Enhanced enforcement and consumer privacy rights |
These regulations have significantly increased the operational complexity of marketing data management, requiring organizations to build robust compliance infrastructure.
Financial Impact of Regulatory Compliance
Maintaining compliance with global privacy regulations involves substantial financial investment. Large enterprises often allocate dedicated budgets toward privacy governance, data management systems, and legal oversight.
Industry research indicates that a large majority of major organizations now spend significant resources each year to maintain compliance with regulatory frameworks.
Annual Compliance Investment Among Large Enterprises
| Compliance Spending Indicator | Percentage of Organizations | Financial Commitment |
|---|---|---|
| Enterprises Spending Over $1 Million Annually on GDPR Compliance | 88% | Large-scale regulatory infrastructure |
| Enterprises Spending Over $10 Million Annually | 40% | Extensive global compliance operations |
These investments typically include legal consultation, data protection technologies, auditing procedures, and ongoing compliance monitoring.
Core Components of Data Privacy Compliance Infrastructure
Achieving regulatory compliance requires organizations to implement a range of processes and tools designed to manage consumer data responsibly. These components form the foundation of modern privacy management systems.
Compliance Infrastructure Cost Breakdown
| Compliance Component | One-Time Setup Cost | Ongoing Annual Cost |
|---|---|---|
| Gap Assessment and Data Mapping | €2,000 – €50,000 | Not typically recurring |
| Legal Documentation and Policy Development | €1,000 – €40,000 | Periodic legal review fees |
| Consent Management Platform (CMP) | €500 – €5,000 | €600 – €25,000 subscription |
| Data Subject Access Request (DSAR) Automation | €5,000 – €40,000 | Software maintenance costs |
| Data Discovery and Classification Tools | €15,000 – €50,000 | Subscription-based pricing |
These systems help organizations track where customer data resides, ensure that consent has been obtained properly, and automate responses to consumer requests related to their personal data.
The Rise of Data Clean Rooms
One of the most important technological innovations enabling privacy-compliant marketing is the development of data clean rooms. These secure environments allow companies to collaborate with partners, advertisers, and publishers by analyzing aggregated datasets without exposing individual-level personal data.
Within a clean room environment, organizations can match their first-party customer data with publisher or partner datasets to generate insights while preserving user anonymity.
Adoption of Privacy-Safe Data Collaboration Technologies
| Privacy Technology | Adoption Rate Among Firms | Strategic Benefit |
|---|---|---|
| Data Clean Rooms | 64% of organizations | Privacy-safe audience matching |
| Consent Management Platforms | Widely adopted | Transparent user consent tracking |
| Data Governance Platforms | Increasing enterprise use | Centralized compliance oversight |
These solutions enable marketers to continue delivering personalized advertising experiences without relying on invasive tracking technologies.
The First-Party Data Strategy
As privacy regulations restrict the use of third-party tracking technologies, organizations are building marketing strategies centered around first-party data collection. First-party data provides a more reliable and compliant foundation for personalization, analytics, and customer engagement.
First-party data sources typically include customer purchase histories, website interactions, loyalty program participation, and direct communication channels such as email subscriptions.
First-Party Data Sources in Modern Marketing
| Data Source | Data Type Collected | Strategic Value |
|---|---|---|
| Website Interactions | Behavioral browsing data | Personalization insights |
| Mobile Applications | User activity and preferences | Engagement tracking |
| Loyalty Programs | Purchase and demographic data | Customer lifetime value analysis |
| Email Marketing Systems | Subscriber engagement metrics | Retention marketing |
Organizations that successfully develop robust first-party data ecosystems gain greater control over customer relationships while reducing reliance on external data providers.
The Emergence of the Retention-First Economy
The shift toward first-party data has also reshaped marketing economics. Instead of focusing exclusively on new customer acquisition, many organizations are prioritizing customer retention and reactivation strategies.
Retention-focused marketing emphasizes engaging existing customers through personalized messaging, loyalty incentives, and remarketing campaigns.
Remarketing and Customer Retention Investment
| Marketing Strategy | Global Investment Trend | Strategic Advantage |
|---|---|---|
| Remarketing Campaigns | $31 Billion global spend (2025) | Higher conversion efficiency |
| Customer Retention Programs | Increasing budget allocation | Improved lifetime value |
| First-Party Personalization | Core marketing strategy | Reduced reliance on external data |
Remarketing campaigns in particular have become a major focus for advertisers. These campaigns target users who have previously interacted with a brand, making them significantly more likely to convert compared with first-time audiences.
Budget Allocation in a Post-Cookie Environment
The decline of third-party tracking has forced marketers to reconsider how budgets are allocated between customer acquisition and retention strategies. Many organizations now recognize that reactivating existing users delivers stronger financial returns than acquiring new customers through expensive advertising campaigns.
Retention-Focused Budget Allocation Trends
| Budget Category | Share of Marketing Budget | Strategic Rationale |
|---|---|---|
| Customer Acquisition | Reduced share compared to previous years | Higher advertising costs |
| Customer Retention | Approximately 29% of marketing budgets | Stronger unit economics |
| First-Party Data Infrastructure | Increasing investment | Privacy-compliant marketing |
This shift reflects a broader transformation in the economics of digital marketing. In a privacy-focused environment, the ability to build long-term customer relationships through trusted data practices has become more valuable than large-scale anonymous audience targeting.
Strategic Implications for Marketing Leaders
Data privacy compliance in 2026 is no longer simply a regulatory requirement; it is a fundamental component of brand strategy and customer experience management. Organizations that embrace privacy-first marketing models are better positioned to build lasting customer trust while maintaining access to valuable consumer insights.
Privacy-Driven Marketing Strategy Matrix
| Strategic Area | Privacy-Oriented Approach | Business Outcome |
|---|---|---|
| Customer Data Collection | First-party data acquisition | Stronger data ownership |
| Audience Targeting | Privacy-safe collaboration tools | Compliant personalization |
| Customer Engagement | Consent-based communication | Increased trust and loyalty |
| Marketing Measurement | Aggregated analytics and clean rooms | Privacy-compliant performance tracking |
As privacy regulations continue evolving and consumers demand greater transparency, organizations that successfully integrate privacy protections into their marketing strategies will gain a significant competitive advantage. In the emerging data economy, trust has become one of the most valuable assets a brand can possess.
10. Decentralized Social and the Frontiers of Media
A new category of digital platforms is beginning to reshape the broader media landscape: decentralized social networks. Unlike traditional social media platforms that are controlled by centralized corporations, decentralized platforms are built on distributed technologies that allow users greater ownership over their data, identities, and audience relationships.
By 2026, the decentralized social media platform market is projected to reach approximately 35.71 billion dollars, expanding at a compound annual growth rate of roughly 18.9 percent. Although still relatively small compared with the traditional social media industry, the rapid growth rate signals a strong underlying shift in how creators and users perceive digital ownership and online governance.
Several factors are driving this trend. Increasing concerns about data privacy, algorithmic control, and content moderation policies on major platforms have encouraged both users and creators to explore alternative social ecosystems where control is more distributed.
Decentralized Social Media Market Overview
| Market Indicator | 2026 Projection | Strategic Significance |
|---|---|---|
| Decentralized Social Media Market Size | $35.71 Billion | Emerging alternative to traditional platforms |
| Market Growth Rate | 18.9% CAGR | Rapid expansion driven by Web3 adoption |
| Core Drivers | Data ownership, censorship resistance, creator autonomy | New digital media model |
These platforms are often built using blockchain-based architectures or decentralized data storage systems, allowing users to maintain control over their social identities and digital assets.
User Motivations Driving Decentralized Platform Adoption
Consumer interest in decentralized social networks is largely driven by dissatisfaction with the structural limitations of traditional social media platforms.
User Motivations for Decentralized Social Platforms
| User Concern | Traditional Platform Limitation | Decentralized Platform Advantage |
|---|---|---|
| Data Privacy | Platforms collect and monetize personal data | Users retain ownership of their data |
| Platform Control | Algorithmic visibility controlled by corporations | Open protocols reduce centralized control |
| Content Moderation | Centralized policies and platform bans | Community-driven governance |
| Creator Monetization | Revenue heavily dependent on platform algorithms | Direct creator-audience relationships |
These factors have encouraged the development of alternative social media ecosystems where users maintain greater autonomy over their digital presence.
Leading Decentralized Social Platforms
Two of the most notable decentralized social platforms emerging in this space are Farcaster and Lens Protocol. While both platforms operate within the broader Web3 ecosystem, they represent two distinct approaches to decentralized social networking.
Farcaster emphasizes a consumer-oriented product model designed to replicate the familiar experience of mainstream social media while introducing decentralized ownership features. Lens Protocol, by contrast, focuses on providing the underlying infrastructure for decentralized social applications.
Comparison of Leading Decentralized Social Platforms
| Platform | Core Philosophy | Technology Model | Strategic Position |
|---|---|---|---|
| Farcaster | Consumer-centric decentralized social network | Application ecosystem with Mini Apps | User-focused social experience |
| Lens Protocol | Infrastructure-driven social protocol | Blockchain-based social graph using NFTs | Developer platform for social applications |
These differing approaches illustrate how decentralized social networks can evolve either as standalone applications or as foundational infrastructure layers supporting multiple applications.
Farcaster: A Consumer-Oriented Web3 Social Network
Farcaster has emerged as one of the most visible decentralized social platforms targeting mainstream users. The platform emphasizes a familiar social networking experience while integrating Web3 principles such as user ownership and open data portability.
A notable innovation within the Farcaster ecosystem is the introduction of “Mini Apps,” lightweight applications that allow developers to build tools and services directly within the platform’s social environment.
Farcaster Platform Growth Indicators
| Metric | Current Estimate | Strategic Implication |
|---|---|---|
| Daily Active Users | 40,000 – 60,000 | Early-stage but growing user base |
| Monetization Model | Subscription-based premium tier | Sustainable creator economy model |
| Annual Pro Subscription | $120 per year | Direct revenue from platform users |
When Farcaster introduced its premium subscription offering, the platform reportedly generated approximately 1.2 million dollars in revenue within the first six hours of monetization. This rapid adoption demonstrates strong demand among early adopters for decentralized social platforms that offer greater ownership and platform independence.
Lens Protocol: Infrastructure for the Decentralized Social Web
Lens Protocol represents a different strategic vision for decentralized social networking. Rather than focusing primarily on a single consumer-facing platform, Lens aims to provide the underlying infrastructure that allows developers to build decentralized social applications.
The core concept behind Lens Protocol is the idea of a portable social graph. In traditional social networks, user relationships and follower networks are controlled by the platform itself. If a user leaves the platform, they lose access to their audience.
Lens addresses this limitation by representing social relationships as blockchain-based digital assets, often implemented as non-fungible tokens (NFTs). This structure allows users to maintain ownership of their social connections across multiple applications.
Lens Protocol Infrastructure Model
| Infrastructure Element | Function | Strategic Advantage |
|---|---|---|
| Tokenized Social Graph | Represents follower relationships as digital assets | User ownership of audience connections |
| Open Developer Framework | Allows developers to build social applications | Expanding ecosystem innovation |
| Cross-Platform Identity | Portable user profiles across applications | Reduced platform dependency |
This infrastructure-driven approach could enable an entire ecosystem of decentralized social platforms built on shared data layers rather than isolated proprietary systems.
The Creator Ownership Model
One of the most important implications of decentralized social platforms is the shift toward creator ownership of audience relationships. In traditional social media systems, creators rely heavily on platform algorithms to reach their audiences. Changes to algorithmic distribution policies can dramatically affect visibility and revenue.
Decentralized social platforms aim to eliminate this dependency by allowing creators to maintain direct ownership of their audience connections.
Creator Economy Comparison: Centralized vs Decentralized Platforms
| Platform Model | Audience Ownership | Revenue Dependency | Creator Autonomy |
|---|---|---|---|
| Centralized Social Platforms | Controlled by the platform | Platform-controlled monetization | Limited |
| Decentralized Social Platforms | Owned by creators | Direct audience monetization | High |
This structure has led some analysts to describe decentralized social networks as the potential “Substack of Web3,” where creators maintain full control over their audiences and monetization strategies.
Early Adoption and Market Limitations
Despite their rapid growth potential, decentralized social networks remain relatively niche platforms compared with mainstream social media giants. User adoption is still limited, and many platforms are primarily used by early adopters, developers, and cryptocurrency communities.
Challenges Facing Decentralized Social Networks
| Challenge | Description | Market Impact |
|---|---|---|
| Limited User Adoption | Smaller user bases compared with major platforms | Slower network effects |
| Technical Complexity | Blockchain-based systems may be difficult for new users | Onboarding barriers |
| Infrastructure Scalability | Distributed networks require robust scaling solutions | Performance considerations |
However, as Web3 technologies mature and privacy concerns continue to grow, decentralized social platforms may gain broader appeal among creators and audiences seeking alternatives to centralized systems.
Strategic Implications for the Future of Media
Decentralized social networks represent a significant conceptual shift in the structure of digital media ecosystems. Rather than relying on centralized corporate platforms, these networks envision a future where social identity, content distribution, and monetization are governed by open protocols and user-controlled data systems.
Decentralized Social Media Strategic Impact Matrix
| Strategic Dimension | Traditional Social Platforms | Decentralized Social Platforms |
|---|---|---|
| Platform Ownership | Corporate platform control | Distributed network governance |
| Data Ownership | Platform-controlled user data | User-controlled personal data |
| Creator Monetization | Platform-mediated revenue models | Direct creator-audience transactions |
| Social Graph | Locked within platform ecosystems | Portable across multiple applications |
Although decentralized social media platforms remain in an early stage of adoption, their underlying principles could influence the future evolution of digital media. As privacy concerns intensify and creators seek greater autonomy, decentralized networks may become an increasingly important component of the global media ecosystem.
11. The Unified Marketing Budget of 2026
The marketing economy in 2026 stands at a defining intersection of technological acceleration and human-centered brand strategy. Global advertising expenditure has surpassed the one-trillion-dollar threshold, but the significance of this milestone extends beyond sheer financial scale. It reflects a profound structural transformation in how organizations allocate capital to capture consumer attention, build brand equity, and drive measurable revenue outcomes.
At the heart of this transformation lies a paradox. On one side, marketing operations are becoming increasingly automated through artificial intelligence, programmatic media buying, and data-driven optimization systems. On the other, consumers are placing greater emphasis on authenticity, transparency, and trust in their relationships with brands. Marketers must therefore operate within an environment where algorithmic efficiency and human credibility coexist as equally critical forces.
The fragmentation of media channels, rising customer acquisition costs, and heightened privacy expectations have made marketing investment both more powerful and more complex. Organizations are no longer simply buying media exposure. Instead, they are constructing integrated marketing systems that combine technology infrastructure, commerce data, audience intelligence, and creative storytelling.
Core Drivers of the Unified Marketing Budget
| Strategic Driver | Market Trend in 2026 | Impact on Marketing Budgets |
|---|---|---|
| Global Advertising Expansion | Total spending exceeds $1 trillion | Larger strategic investment in media |
| AI Integration | Automation embedded across marketing workflows | Efficiency and productivity gains |
| Commerce Media Growth | Retail media networks expanding rapidly | Increased budget allocation near purchase environments |
| Data Privacy Regulation | Shift toward first-party data ownership | Investment in data infrastructure |
| Audience Fragmentation | Multiple platforms competing for attention | Diversified media strategies |
These forces collectively define the modern marketing budget, which has evolved into a complex portfolio of investments spanning technology, media, data infrastructure, and customer experience.
The Algorithmic Era of Marketing Strategy
Industry analysts increasingly describe the current environment as the “Algorithmic Era.” In this phase of marketing evolution, algorithms determine how advertising impressions are distributed, how audiences are segmented, and how campaigns are optimized in real time.
However, success in this environment is not purely technological. The most effective marketing strategies balance automation with strategic brand building.
Many organizations are now adopting a balanced investment framework that divides resources evenly between long-term brand development and short-term performance marketing.
Balanced Marketing Investment Model
| Marketing Investment Category | Budget Allocation Trend | Strategic Purpose |
|---|---|---|
| Brand Building | Approximately 50% | Establish long-term trust and awareness |
| Performance Marketing | Approximately 50% | Drive measurable revenue and customer acquisition |
This balanced approach reflects a growing recognition that brand credibility amplifies the effectiveness of performance marketing campaigns. In complex purchasing environments—particularly in B2B and high-consideration consumer markets—brand trust becomes a prerequisite for conversion.
Artificial Intelligence as a Marketing Productivity Engine
Artificial intelligence has become one of the most influential drivers of marketing efficiency in 2026. AI systems are now deeply embedded within marketing workflows, assisting with tasks such as campaign optimization, audience targeting, predictive analytics, and content generation.
One of the most immediate benefits of AI integration is the substantial improvement in workforce productivity. Marketing professionals report saving significant amounts of time by automating repetitive tasks such as data analysis, reporting, and content drafting.
AI Productivity Impact on Marketing Operations
| Productivity Metric | Observed Impact | Strategic Value |
|---|---|---|
| Weekly Time Saved by Marketers | Approximately 13 hours | Increased operational efficiency |
| Productivity Improvement | Approximately 44% increase | Faster campaign execution |
| Content Production Capacity | 42% more content published monthly | Greater brand visibility |
These productivity gains allow marketing teams to focus more heavily on strategic planning, creative experimentation, and customer experience design rather than manual operational tasks.
Retail Media and Commerce-Driven Advertising
Another defining element of the 2026 marketing budget is the rapid expansion of retail media networks. Retail platforms have transformed themselves into high-margin advertising ecosystems by monetizing their first-party shopper data.
Retail media represents one of the few advertising environments where marketers can connect promotional exposure directly to verified purchasing behavior.
Retail Media Strategic Role in Marketing Budgets
| Retail Media Advantage | Marketing Benefit |
|---|---|
| Closed-Loop Attribution | Direct measurement of advertising impact on sales |
| High Purchase Intent | Consumers are already in shopping mode |
| First-Party Data Access | Precise audience targeting |
| High Operating Margins for Retailers | Rapid expansion of media networks |
Because retail media campaigns occur near the point of purchase, they often deliver significantly higher conversion rates than traditional display advertising channels.
The Hidden Cost of Marketing Technology
Despite the benefits of automation and advanced analytics, marketing technology infrastructure introduces significant financial complexity. Modern marketing organizations rely on extensive technology stacks that include data platforms, automation tools, analytics systems, and customer engagement software.
The total cost of operating these systems is frequently underestimated. Licensing fees represent only a portion of the overall expense. Implementation services, integration infrastructure, data management, and operational staffing contribute substantially to the true cost of ownership.
MarTech Cost Structure Overview
| Cost Category | Role in Marketing Operations |
|---|---|
| Software Licensing | Core marketing technology platforms |
| Implementation and Customization | Deployment of enterprise systems |
| Integration Infrastructure | Connecting multiple technology platforms |
| Data Management | Ensuring data accuracy and accessibility |
| Operational Staffing | Maintaining system performance |
For marketing leaders, managing the financial complexity of technology ecosystems has become as important as selecting the right platforms.
The First-Party Data Imperative
The decline of third-party cookies and the expansion of privacy regulations have reshaped how organizations collect and utilize customer data. In 2026, ownership of first-party data has become one of the most valuable strategic assets available to marketers.
Rather than relying on anonymous third-party tracking technologies, brands are building direct relationships with consumers through consent-based data collection.
First-Party Data Strategic Advantages
| Data Strategy | Business Benefit |
|---|---|
| Direct Customer Relationships | Greater brand trust |
| Privacy Compliance | Alignment with global regulations |
| Personalized Experiences | Improved engagement and retention |
| Long-Term Data Ownership | Reduced reliance on external platforms |
Organizations that successfully develop robust first-party data ecosystems gain greater control over their marketing strategies while strengthening customer loyalty.
Bridging Innovation and Measurable Outcomes
The continued expansion of artificial intelligence investment represents one of the most significant developments shaping the marketing landscape. As AI evolves into a multi-trillion-dollar global infrastructure layer, companies must move beyond experimental pilot programs toward measurable financial outcomes.
Many organizations have historically struggled with what analysts describe as “pilot purgatory,” where promising technology initiatives fail to scale into operational systems that generate measurable value.
AI Adoption Maturity Framework
| AI Adoption Stage | Organizational Focus | Business Outcome |
|---|---|---|
| Experimental Pilots | Testing new AI capabilities | Limited operational impact |
| Operational Integration | Embedding AI into marketing workflows | Efficiency improvements |
| Strategic Automation | Autonomous campaign management | Revenue growth and scalability |
Organizations that successfully transition to the final stage gain substantial competitive advantages through faster decision-making, improved customer targeting, and more efficient marketing operations.
Marketing Budgets as Strategic Signals
The unified marketing budget of 2026 represents far more than a collection of media expenditures. It reflects a broader reallocation of corporate capital toward intelligence, data infrastructure, and consumer relationship management.
Modern marketing budgets function as strategic signals that reveal how organizations intend to compete within the digital economy.
Unified Marketing Budget Structure
| Budget Category | Strategic Function |
|---|---|
| Media Investment | Capturing audience attention |
| Technology Infrastructure | Enabling automation and analytics |
| Data Platforms | Managing customer intelligence |
| Creative Development | Building brand narratives |
| Customer Experience | Strengthening long-term loyalty |
Together, these investments define the operational foundation of modern marketing organizations.
The trillion-dollar advertising milestone therefore represents more than the growth of an industry. It highlights the increasing centrality of marketing within the global economy. Marketing now sits at the intersection of technology, commerce, and culture, shaping how businesses communicate value and how consumers discover and trust brands.
In 2026, marketing budgets serve as statements of strategic intent. They reveal how companies are allocating capital to navigate a complex digital environment defined by artificial intelligence, privacy regulation, platform ecosystems, and evolving consumer expectations. The organizations that succeed will be those capable of integrating automation with authenticity, data with creativity, and efficiency with trust.
Conclusion
The marketing landscape of 2026 represents one of the most significant structural transformations the industry has experienced in decades. What once revolved around media buying and campaign messaging has evolved into a highly integrated ecosystem that blends technology infrastructure, artificial intelligence, data governance, commerce integration, and human-centered brand strategy. The trillion-dollar milestone in global advertising expenditure serves not only as a measure of scale but also as evidence of how central marketing has become to the functioning of the modern digital economy.
Marketers in 2026 are no longer simply allocating budgets across channels. Instead, they are strategically redistributing capital across a multi-layered framework that includes digital media platforms, AI-driven automation, retail media networks, first-party data ecosystems, and advanced marketing technology stacks. This unified budget reflects a broader transition toward intelligence-driven marketing operations where every dollar is expected to produce measurable outcomes while strengthening long-term brand trust.
The New Economics of Global Marketing Spend
One of the defining themes of marketing investment in 2026 is the decoupling of advertising growth from general economic expansion. Global advertising spend is growing faster than global GDP, highlighting the increasing importance of marketing as a catalyst for business growth. Companies are investing more aggressively in marketing not simply to maintain visibility, but to generate demand in an environment where consumer attention is fragmented across dozens of digital platforms.
The expansion of digital media continues to dominate this spending. Digital channels now account for the majority of advertising budgets, supported by the rise of programmatic buying, mobile-first engagement, and video-based content ecosystems. This transformation has fundamentally changed how marketers approach media planning. Instead of focusing solely on reach and frequency, marketers are prioritizing outcome-based investments tied to conversions, customer lifetime value, and measurable revenue impact.
This shift reflects the maturation of the digital advertising ecosystem, where real-time performance data allows marketers to continuously refine their strategies and allocate budgets dynamically.
Artificial Intelligence as the Operational Backbone of Marketing
Artificial intelligence has become one of the most powerful forces shaping marketing strategy in 2026. What was once considered an experimental technology is now embedded within nearly every stage of the marketing process. AI tools assist with audience segmentation, predictive analytics, campaign optimization, creative generation, and real-time performance analysis.
The economic impact of AI adoption is substantial. Marketers are saving significant time through automation, enabling them to focus on strategic planning and creative development. At the same time, AI-driven systems allow organizations to scale marketing operations more efficiently, delivering personalized experiences to millions of consumers simultaneously.
The emergence of agentic AI systems marks an even more advanced stage of this transformation. Autonomous AI agents are increasingly capable of managing complex campaign orchestration, optimizing media investments in real time, and identifying performance opportunities across multiple channels. These developments indicate that marketing is rapidly evolving into a hybrid discipline where human creativity and machine intelligence operate in tandem.
Retail Media and the Commerce-Centric Marketing Model
Another defining trend shaping how marketers are spending in 2026 is the rapid rise of retail media networks. Retailers have transformed their digital marketplaces into powerful advertising platforms that allow brands to target consumers directly within shopping environments.
Retail media offers something that traditional advertising channels often cannot provide: closed-loop attribution. Because advertising occurs within platforms where transactions take place, marketers can directly measure how promotional exposure influences purchasing behavior.
This capability has made retail media one of the fastest-growing segments of the digital advertising market. Brands are increasingly allocating budgets toward commerce-driven advertising environments where consumer intent is strongest and conversion rates are highest. As retailers continue to expand their advertising infrastructure across websites, mobile applications, and physical stores, retail media is likely to remain a major growth engine in global marketing budgets.
The Rise of Privacy-First Marketing and First-Party Data
While technology and automation have transformed marketing operations, the rise of data privacy regulations has introduced an equally powerful shift in how marketers approach consumer relationships. The deprecation of third-party cookies and the enforcement of privacy regulations have forced organizations to adopt new data strategies centered on transparency, consent, and trust.
First-party data has therefore become one of the most valuable assets in modern marketing. Brands are investing heavily in systems that allow them to collect and activate customer data through direct relationships, such as loyalty programs, owned digital platforms, and consent-based communication channels.
This shift toward first-party data strategies has also reinforced the importance of customer retention. In a post-cookie environment, retaining and reactivating existing customers often delivers stronger economic returns than continuously acquiring new audiences through expensive advertising campaigns.
As a result, remarketing and customer lifecycle marketing have become critical components of marketing budgets in 2026.
The Expanding Role of the Marketing Technology Stack
Modern marketing operations rely on complex technology infrastructures that integrate data platforms, automation tools, analytics systems, and customer experience management software. The global MarTech industry has grown rapidly as organizations seek to unify their marketing operations across multiple channels.
However, the expansion of marketing technology also introduces new financial considerations. Many organizations underestimate the total cost of operating a comprehensive MarTech stack. Implementation, integration, data management, and operational staffing often represent a substantial portion of the overall technology investment.
For marketing leaders, managing the economics of the MarTech ecosystem has become as important as selecting the right tools. The organizations that succeed are those capable of consolidating technologies, maintaining clean data architectures, and ensuring that their technology investments translate into measurable marketing performance.
Social Platforms and the Creator Economy
Social media continues to command a significant share of global marketing budgets, driven by its unmatched ability to capture consumer attention. Platforms centered around short-form video, creator-driven content, and algorithmic discovery are attracting large advertising investments from brands seeking to reach highly engaged audiences.
The growth of the creator economy has further expanded the role of social platforms in marketing strategy. Influencer partnerships have evolved into structured marketing channels where brands collaborate with creators to deliver authentic content experiences that resonate with specific communities.
Brands are increasingly working with smaller creators who maintain highly engaged audiences rather than relying solely on large celebrity influencers. This shift reflects a growing recognition that authenticity and trust often drive stronger engagement and conversion rates than sheer audience scale.
Decentralized Media and Emerging Platform Models
Beyond established platforms, the digital media landscape is also beginning to explore decentralized social networks built on distributed technologies. Although still in the early stages of adoption, these platforms represent a potential future where users and creators maintain greater control over their data, identities, and audience relationships.
The development of decentralized social ecosystems highlights the broader evolution of digital media, where control over audience relationships is becoming increasingly valuable. If these platforms continue to mature, they could introduce entirely new marketing models based on direct creator-audience ownership.
The Unified Marketing Budget of the Future
Ultimately, the way marketers are spending in 2026 reflects a broader redefinition of the marketing function itself. Marketing is no longer limited to communication and promotion. It has evolved into a central strategic discipline that connects data intelligence, customer experience, brand storytelling, and revenue generation.
Modern marketing budgets are structured across multiple strategic layers. These include media investments designed to capture attention, technology infrastructure that powers automation and analytics, data platforms that enable personalized experiences, and creative initiatives that build brand identity.
This unified budget framework allows organizations to operate more effectively in an increasingly complex digital environment where success depends on both technological capability and human trust.
Final Perspective on Marketing Investment in 2026
The trillion-dollar advertising milestone represents more than the expansion of marketing expenditure. It reflects the growing importance of marketing as a strategic engine for economic growth, business innovation, and consumer engagement.
In 2026, the most successful marketers are those who combine automation with creativity, data intelligence with ethical responsibility, and performance optimization with long-term brand building. They recognize that while technology can dramatically improve efficiency, trust remains the most valuable currency in the relationship between brands and consumers.
As artificial intelligence continues to expand, retail media reshapes commerce-driven advertising, and privacy regulations redefine data strategy, marketing leaders must remain adaptable. The future of marketing will belong to organizations that can integrate these forces into cohesive strategies that deliver both measurable results and meaningful consumer experiences.
The story of how marketers are spending in 2026 is therefore not simply about larger budgets or new technologies. It is about the transformation of marketing into a discipline that sits at the heart of the global digital economy, guiding how businesses create value, connect with audiences, and build lasting relationships in an increasingly intelligent and interconnected world.
If you are looking for a top-class digital marketer, then book a free consultation slot here.
If you find this article useful, why not share it with your friends and business partners, and also leave a nice comment below?
We, at the AppLabx Research Team, strive to bring the latest and most meaningful data, guides, and statistics to your doorstep.
To get access to top-quality guides, click over to the AppLabx Blog.
People also ask
What are the biggest marketing spending trends in 2026?
Marketing spend in 2026 is heavily focused on digital channels, AI-driven automation, retail media networks, and first-party data. Brands are investing more in performance marketing, short-form video, and privacy-compliant data strategies to reach fragmented audiences.
How much are companies spending on marketing in 2026?
Most companies allocate between 7.7% and 9.4% of revenue to marketing. High-growth sectors like SaaS and consumer products often spend significantly more to maintain competitive visibility and accelerate customer acquisition.
Why has global advertising spend exceeded $1 trillion in 2026?
The rise of digital media, AI-powered marketing platforms, and commerce-driven advertising has accelerated global ad spending. Companies increasingly rely on marketing to drive demand and compete in crowded digital markets.
What percentage of marketing budgets go to digital channels in 2026?
Digital channels account for roughly 68% to 76% of total global advertising spend. Marketers prioritize mobile advertising, social media, programmatic display, search, and video-based platforms.
How are marketers using artificial intelligence in 2026?
Marketers use AI to automate campaigns, analyze customer data, personalize content, and optimize advertising performance in real time. AI also helps reduce manual tasks and improves marketing productivity.
What is agentic AI in marketing?
Agentic AI refers to autonomous systems that manage marketing tasks such as campaign optimization, audience targeting, and performance analysis. These tools allow marketers to run complex campaigns with minimal manual input.
Why is first-party data important for marketers in 2026?
First-party data allows brands to build direct relationships with customers while complying with privacy regulations. It supports personalized marketing, improves customer insights, and reduces reliance on third-party tracking.
How has the end of third-party cookies affected marketing budgets?
The removal of third-party cookies has shifted budgets toward first-party data platforms, customer data platforms, and privacy-safe advertising technologies such as data clean rooms and contextual targeting.
What role does retail media play in marketing spend in 2026?
Retail media networks have become one of the fastest-growing advertising channels. Brands invest in retail platforms because they provide high-intent audiences and closed-loop measurement linking ads directly to purchases.
How much is the retail media market worth in 2026?
Retail media spending is projected to reach between $165 billion and $200 billion globally. Retailers monetize shopper data by offering advertising opportunities within their online marketplaces and stores.
Which social media platforms receive the most advertising spend in 2026?
Major platforms such as TikTok, Instagram, YouTube, Facebook, and LinkedIn dominate social media ad budgets due to their large audiences, strong engagement rates, and advanced advertising tools.
Why is TikTok important for marketing in 2026?
TikTok drives high engagement and strong conversion rates through short-form video content. Many marketers consider it one of the highest ROI social platforms for influencer campaigns and brand discovery.
How big is the influencer marketing industry in 2026?
Influencer marketing is expected to reach around $32 billion to $35 billion globally. Brands increasingly partner with creators to produce authentic content that connects with specific audiences.
Why are brands working with nano and micro influencers more often?
Nano and micro influencers often have stronger engagement rates and more authentic relationships with their audiences. This allows brands to reach niche communities with higher trust and better campaign performance.
What marketing channels generate the highest ROI in 2026?
Organic search, email marketing, retail media, and influencer campaigns often deliver the strongest ROI. SEO remains particularly effective because it generates long-term inbound traffic and leads.
How much do B2B companies spend on marketing in 2026?
B2B organizations typically spend around 6% to 9% of revenue on marketing. However, fast-growing technology companies may invest more to drive demand and establish brand authority.
Why are B2B marketers focusing more on brand building?
Complex buying decisions often involve multiple stakeholders. Strong brand reputation increases trust and improves the effectiveness of performance marketing campaigns in enterprise sales environments.
What is the typical marketing budget split between brand and performance?
Many organizations now follow a balanced 50/50 split between brand building and performance marketing. This approach combines long-term brand growth with short-term revenue generation.
What is a MarTech stack and why is it important?
A MarTech stack is a collection of marketing technology tools used for automation, analytics, CRM, content management, and data integration. It helps marketers manage campaigns and track customer interactions.
How large is the MarTech market in 2026?
The global marketing technology market is projected to reach approximately $714 billion. Businesses rely on MarTech tools to manage digital campaigns, customer data, and marketing automation.
Why do MarTech systems cost more than expected?
The total cost includes licensing, implementation, integration, data management, and operational staffing. These hidden expenses often increase the real cost of marketing technology systems.
What is a customer data platform (CDP)?
A customer data platform collects and organizes customer data from multiple sources to create unified customer profiles. This allows marketers to deliver personalized experiences across different channels.
How are marketers handling data privacy regulations in 2026?
Companies invest in consent management tools, data governance systems, and privacy compliance frameworks to meet regulations like GDPR, CCPA, and CPPA while maintaining customer trust.
What are data clean rooms in marketing?
Data clean rooms are secure environments where companies can combine datasets with partners or publishers without exposing personal information. They enable privacy-safe audience targeting and campaign measurement.
Why is customer retention becoming a major marketing focus?
Retaining existing customers is often cheaper than acquiring new ones. Remarketing campaigns and loyalty programs help increase lifetime value and reduce acquisition costs.
How much time do marketers save using AI tools?
Many marketers report saving around 13 hours per week using AI-driven tools for automation, data analysis, and content creation, improving overall productivity.
How are mobile devices influencing marketing strategies?
Mobile devices generate the majority of digital advertising impressions. Marketers focus on mobile-first formats such as vertical video, social media ads, and app-based experiences.
What are decentralized social platforms and why do they matter?
Decentralized social networks allow users to control their data and audience relationships. Although still emerging, they could reshape digital media and creator monetization models.
What industries spend the most on marketing in 2026?
Industries such as SaaS, consumer products, pharmaceuticals, and e-commerce typically invest heavily in marketing to maintain growth, acquire customers, and build brand awareness.
What will shape marketing budgets beyond 2026?
Artificial intelligence, privacy-first data strategies, retail media growth, creator-driven content, and advanced marketing technology platforms will continue shaping marketing investment decisions.
Sources
Dentsu
ANA
Affinco
INMA
Cropink
LoopEx Digital
GlobeNewswire
AppsFlyer
WordStream
New Media
The Goat Agency
Fugo AI
Adtelligent
Retail Media Age
Mordor Intelligence
AdCellerant
Glorium Technologies
NVIDIA
Adobe
Digital Marketing Institute
PNC Logos
SociallyIn
AMRA & Elma
Archive
Charle Agency
Whitehat SEO
TrueFuture Media
MEXC News
William Flaiz
Tealium
Secure Privacy
The S Marketers
Data Insights Market
Blockeden
Cool Nerds Marketing


 Image Sizes in 2024: The Ultimate Guide")


